State-of-the-Art Data Acquisition and Control
Designed by aerospace engineers. Easier-Faster-Better. DAQAstra cuts your programming and set-up effort by up to 90%. Spend your time running tests and experiments, not battling antiquated systems
Powerful and Simple Design
A better user experience:
- Built-in code-free support, no need for coding experience.
- Growing library of standard peripherals.
- A powerful, modern, high level programming environment to integrate any custom peripheral.
Unlimited Hardware Compatibility
- Comprehensive I/O options featuring multiple ADCs and DACs, versatile GPIO with PWM, and high-current SSR.
- Supports ubiquitous industry standard interfaces including USB, CANBus, SPI, Serial, and I2C.
- Easily expandable via MikroBUS™ click board.
Configuration-Free Fleet Management
Powerful, simple orchestration:
- Supports numerous DAQAstra boards on user network
- Full software configuration control.
- Data recorded and easily accessible on your local network.
Seamless IoT Network Integration
- Power over Ethernet (PoE) not bulky power supplies.
- Bundled middleware for direct integration with existing networks.
- Database-driven architecture for seamless design and system extension. DAQAstra is a data-acquisition and controls system designed to streamline R&D data acquisition, allowing engineers to focus on the mission at hand. This system is built on the shoulders of open-source frameworks, ensuring long-term support and enabling user-defined custom functionality.
Features
- Code-free configuration for basic functionality.
- Firmware written in the Rust Programming Language, for memory-safe, fearless concurrency in an RTOS-like environment.
- Power over Ethernet (PoE) standard 802.3af (802.3at, Type 1) compliance.
- IoT-functionality for network-wide data-acquisition and control systems.
- Plug-and-play management server, with a simple web-interface for configuring DAQAstra, managing board configurations & status.
- Network self-discovery, DAQAstra will connect to the application on power-up. No need to configure IPs
- Node-Red Integration, for open-source, code-free interfacing with DAQAstra and other network-enabled devices.
- Expansive Interface Support: I2C, SPI, UART, Ethernet
- MikroBUS Integration: DAQAstra is compatible with Mikrobus expansion boards.
- A large peripheral suite with a diverse set of sensors and actuators.
- In-firmware modules for fast implementation of PID and various DSP functions.
Getting Started
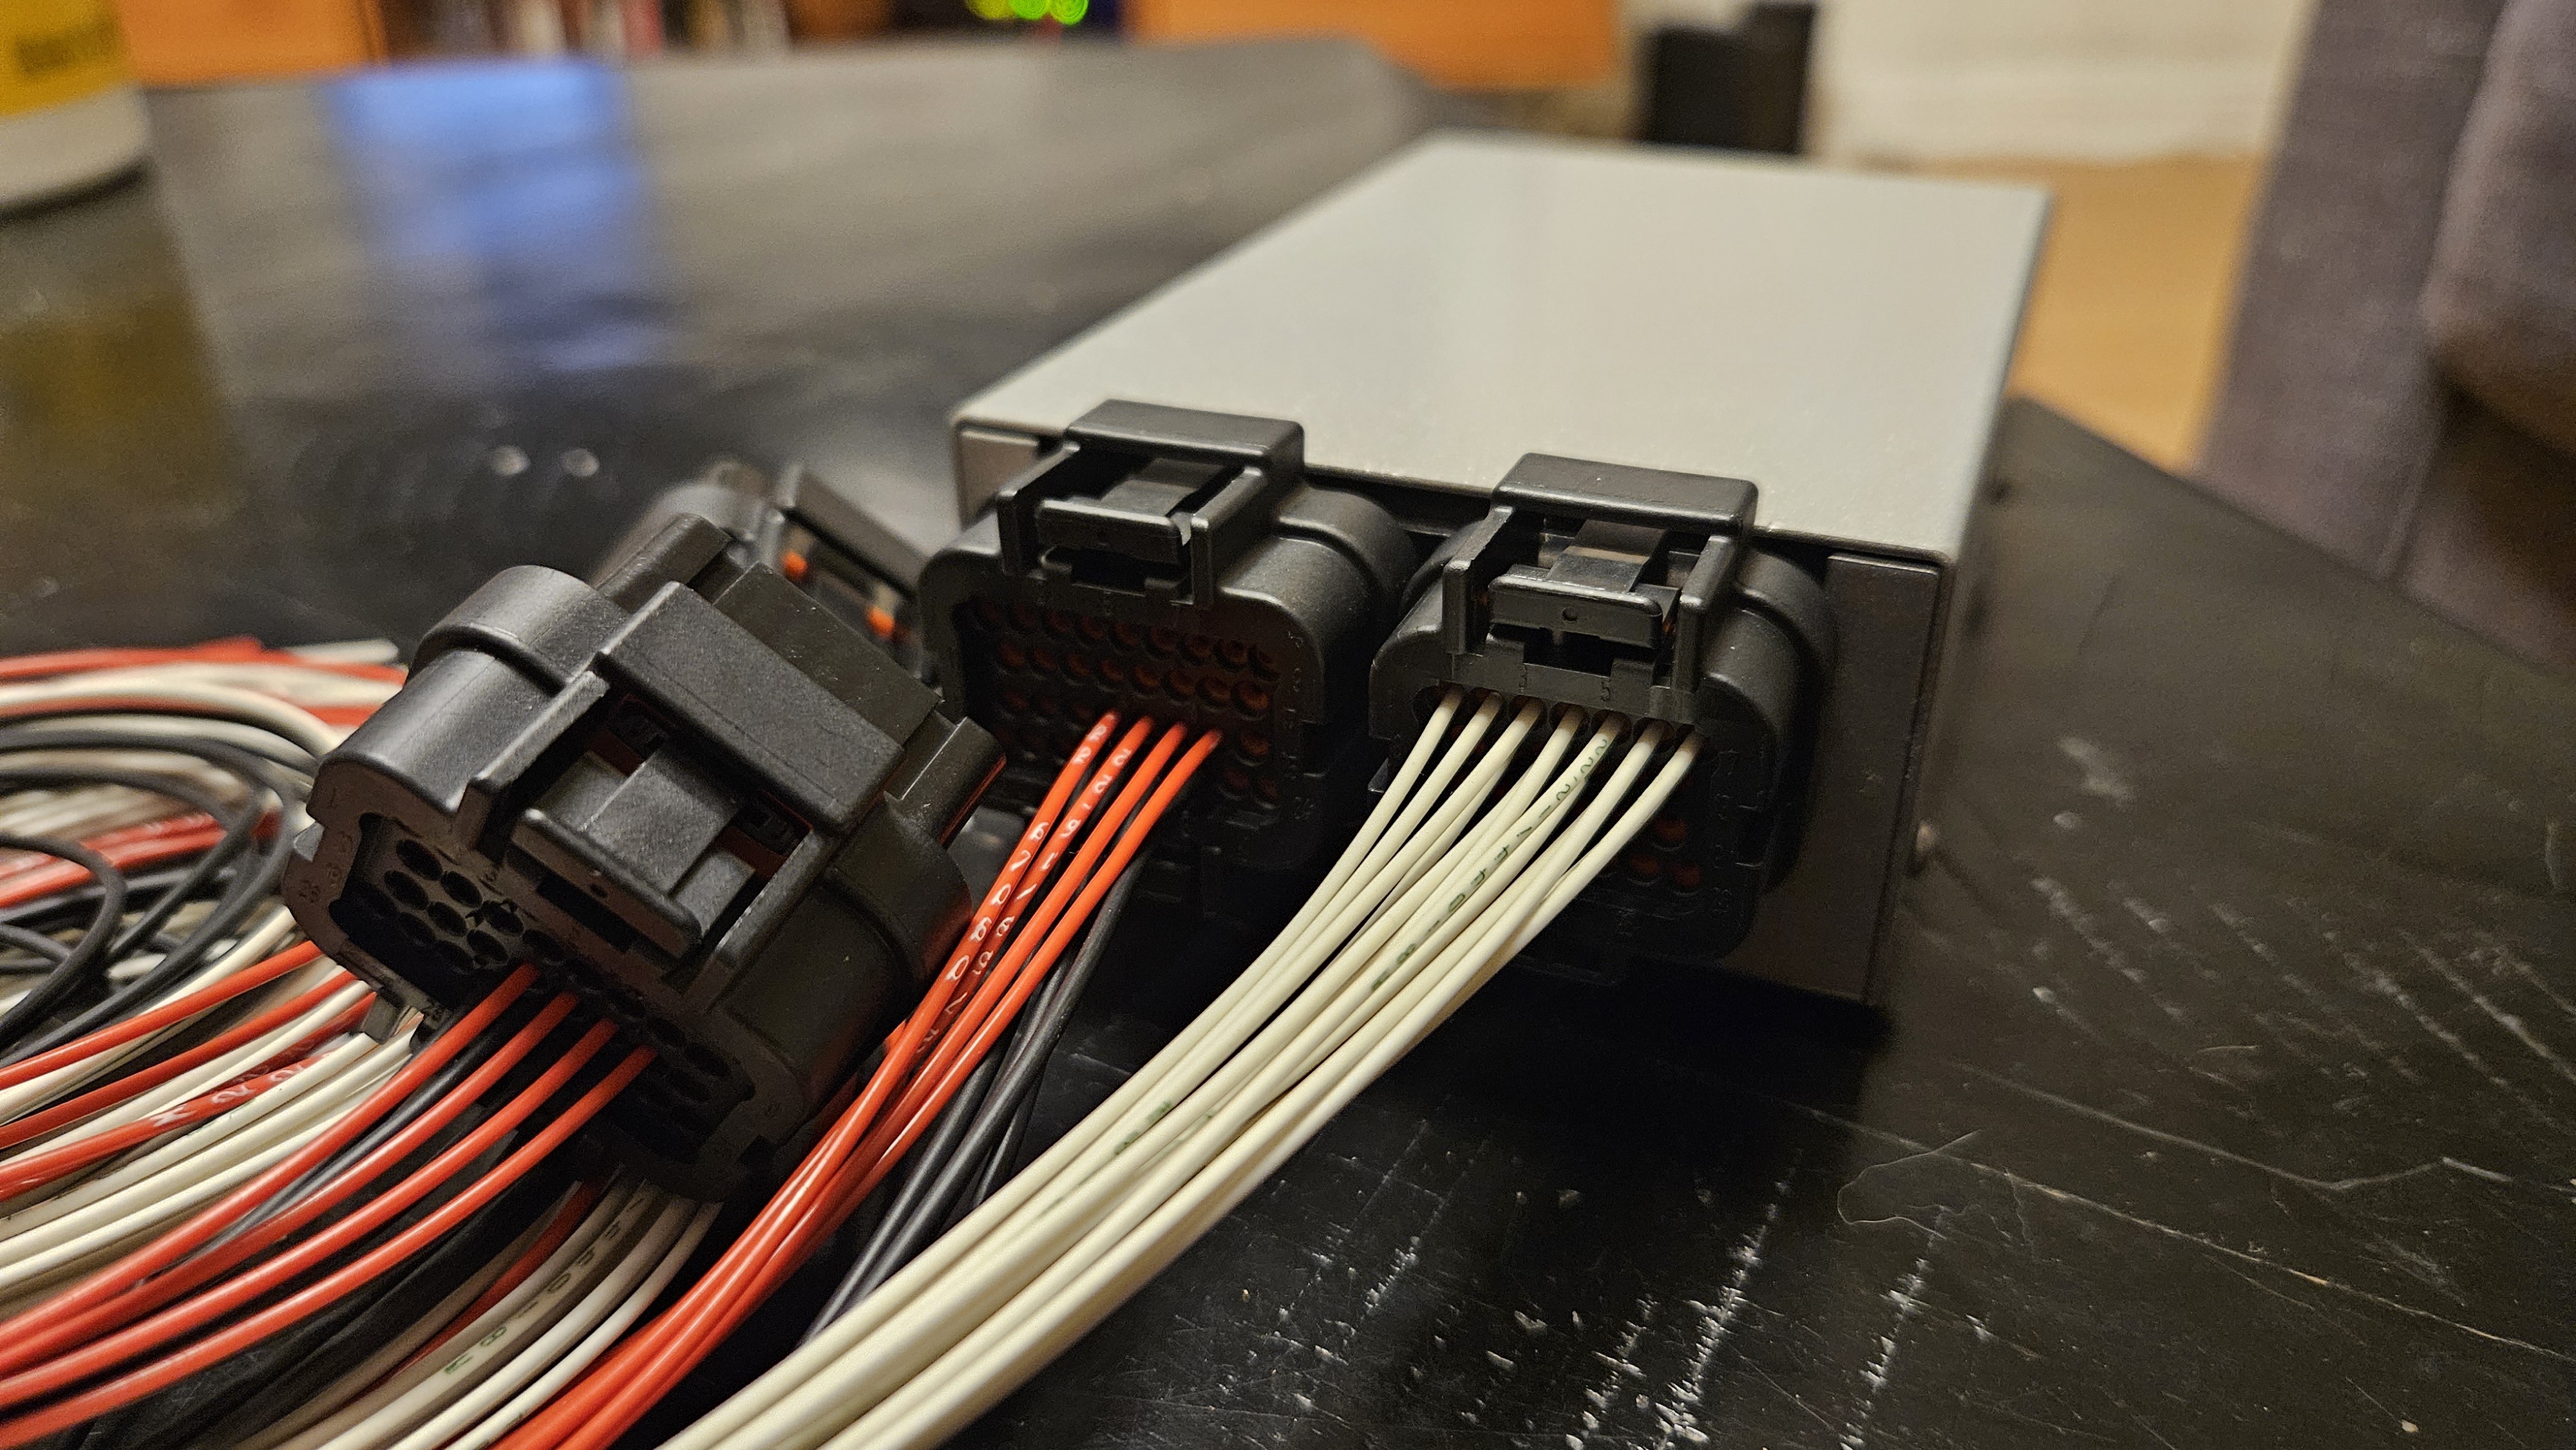
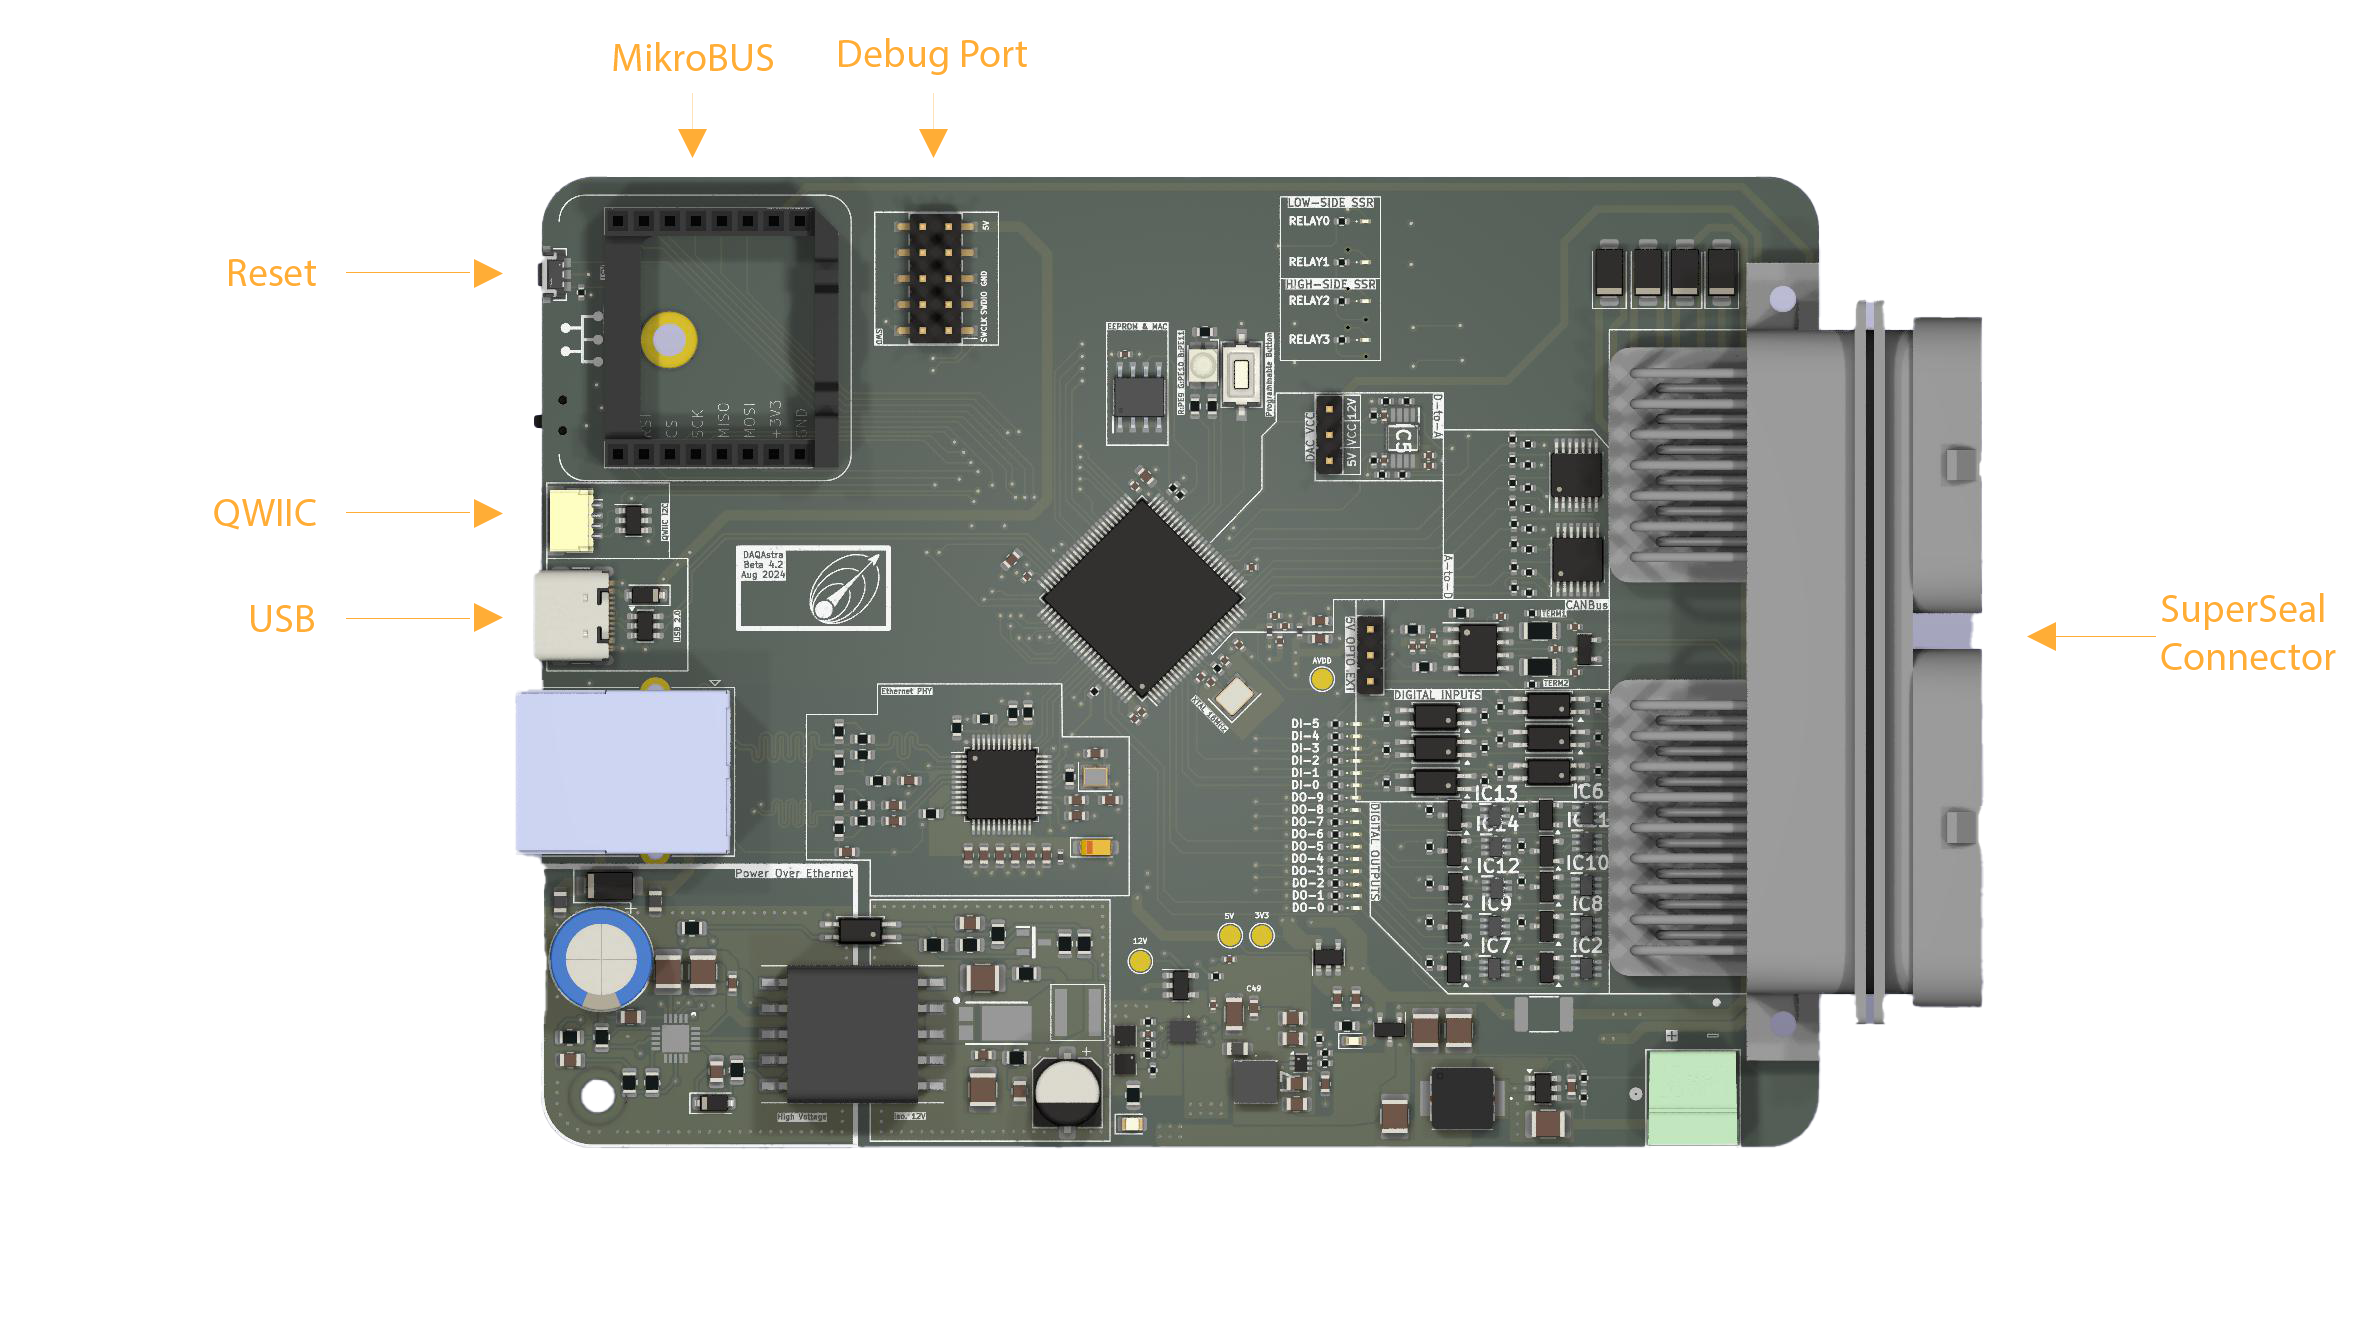
Anatomy
The DAQAstra system consists of two main components, the DAQAstra boards and a computer or server that can run the middleware software, which we call the Application, which does the following:
- Manages the connection to all the DAQAstra boards on a network
- Builds custom firmware on-the-fly based on user definitions in natural language
- Captures and records all time-series data from the DAQAstra
- Generates interactive LAN-accessible dashboards to control the interfaces configured on a DAQAstra.
The basic system is extensible as the application can manage a large number of DAQAstras on the network. The single requirement to get the application to work with a DAQAstra is to simply have them both online on the same network.
Accessing the UI
Once you have the application running, given it is not a headless flavor of the software, the UI will open as a native application on your desktop. However, the user-interface will also be hosted at the IP address of the machine hosting the Application on port 5172. In the headless case, there will be no native GUI and the app will only be accessible via a web-browser at the same port.
If you have TLS certs configured on your instance, http:// requests to port 5172 will be re-directed to https:// on port 5174. See how to configure TLS.
User-Interface Tour
This video shows basic access to the main pages of the application which will be covered in order as shown in the video with the relevant pages of this user-guide linked.
-
The first button pressed shows the light-mode/dark-mode toggle.
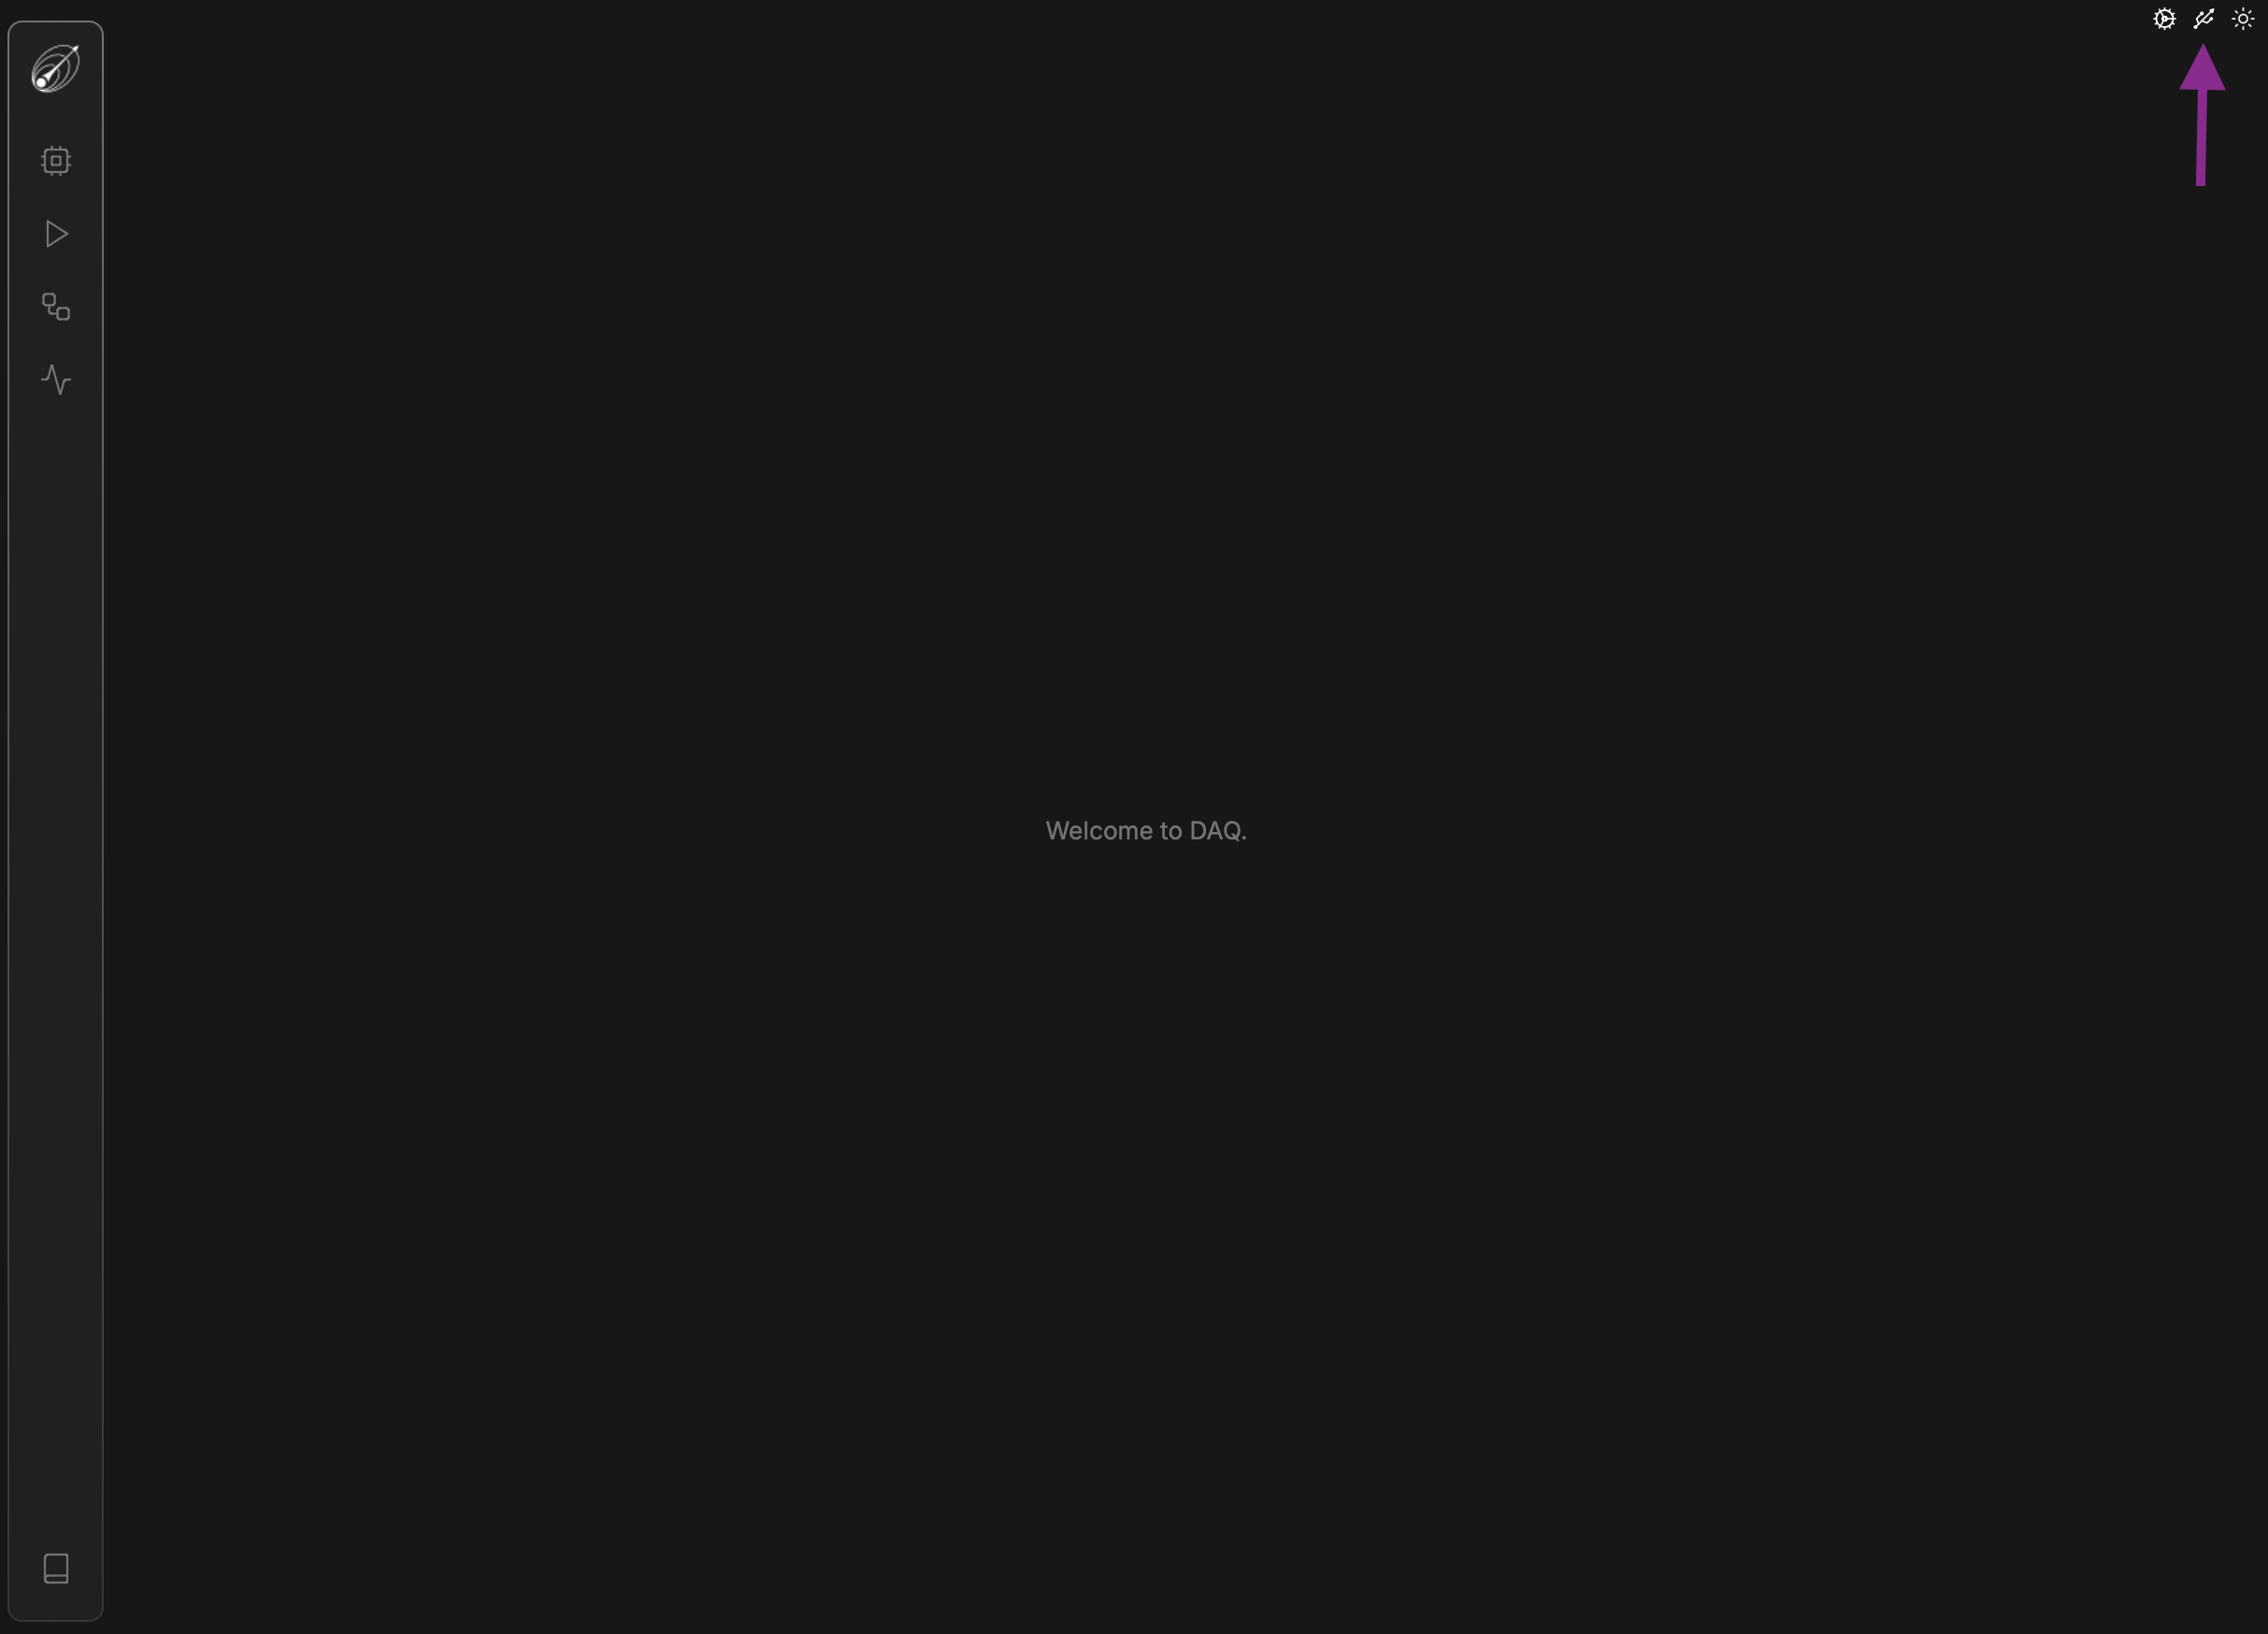
-
The USB Recovery page, if a DAQ ever gets stuck in a certain firmware or is boot-looping, you can recover that device using an STLink programmer. The steps are laid out in this guide.
-
Builder service history. This panel will display all of the firmware builds requested the an instance of the application. It does not persist through application restarts. The button itself displays the state of the service which is useful when multiple people are accessing the UI and concurrently requesting a build.
-
Devices Page. Accessible via
Ctrl/Cmd + 1. The side-panel is collapsible usingCtrl/Cmd + BorCtrl/Cmd + \. The functionality of this page is covered here. -
Run Page. Accessible via
Ctrl/Cmd + 2. This page displays the Node-RED dashboards as generated by the application. Your personal dashboards would appear here, too. The usage of this page is covered in the Operations section. -
Flow Builder Page. Accessible via
Ctrl/Cmd + 3. This will show the Node-RED flows that act as the backend of the generated and user-modified dashboards and automations. If one wants to modify a dashboard or add alarms or other devices over the network to the DAQAstra ecosystem, this is where it would be done. See the demo to learn more. -
Analyze Page. Accessible via
Ctrl/Cmd + 4. This will give you access to the bundled InfluxDB interface where you can see historical data and perform post-test analysis. A more in-depth look at how to use this tool is covered in the Operations section. -
User-Guide. Accessible via
Ctrl/Cmd + 5. This is an embedded version of this documentation in the application.
Definitions
Home Page
When a user launches the DAQAstra App for the first time, they are greeted with a "Welcome to DAQAstra" screen. This page includes a Sun/Moon icon, allowing users to toggle between light and dark modes. Additionally, a sidebar featuring multiple icons provides navigation throughout the app. Each icon represents a specific section, and once familiarized, users can efficiently navigate the interface.
The sidebar includes the following icons:
Home PageDevices PageProjects PageDashboard PageAnalysis Page
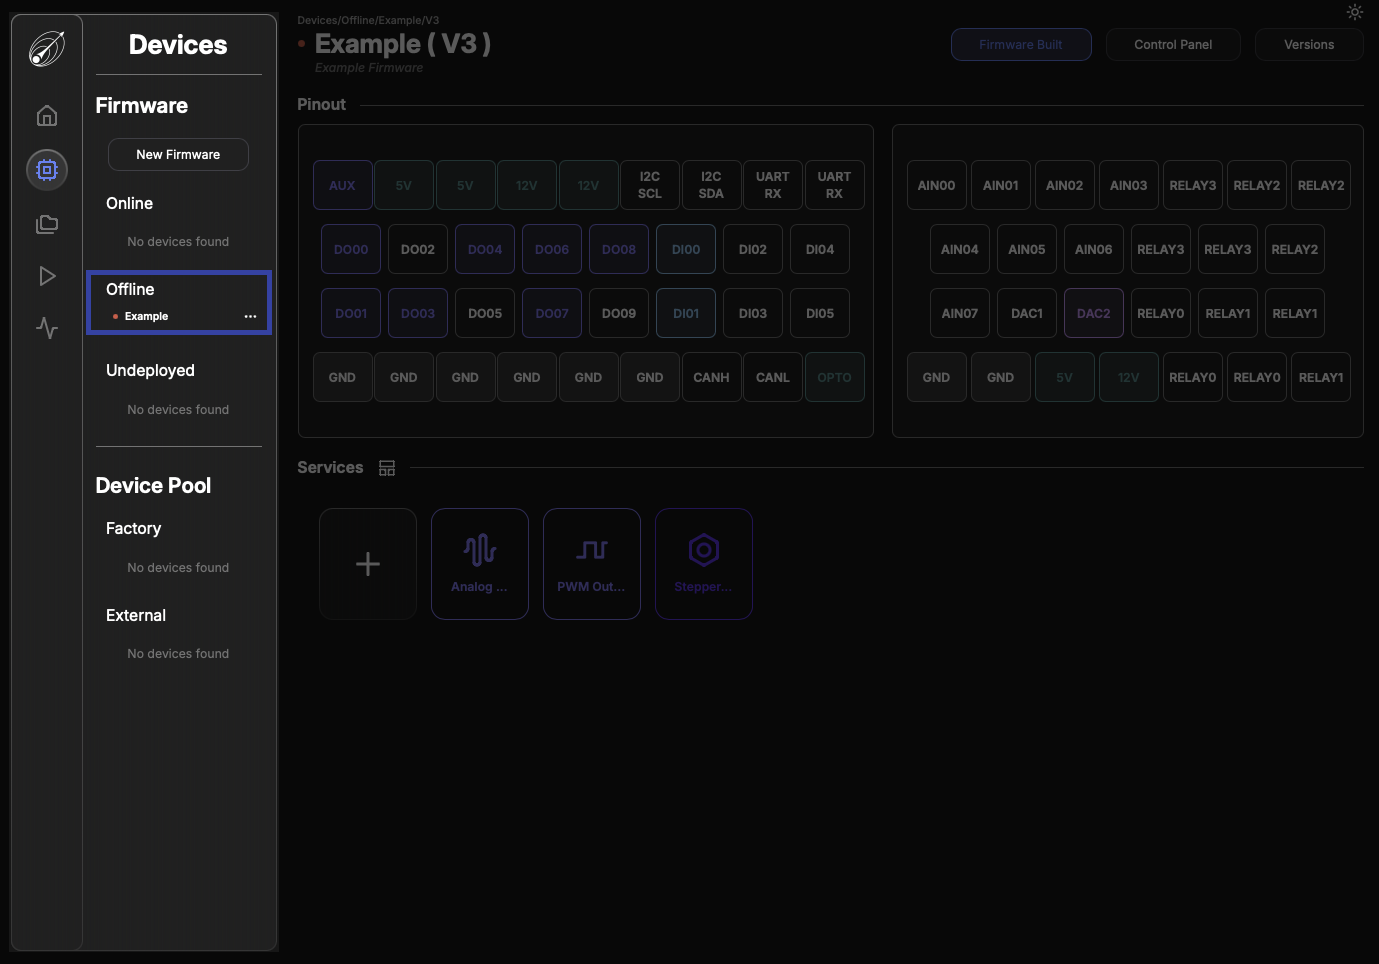
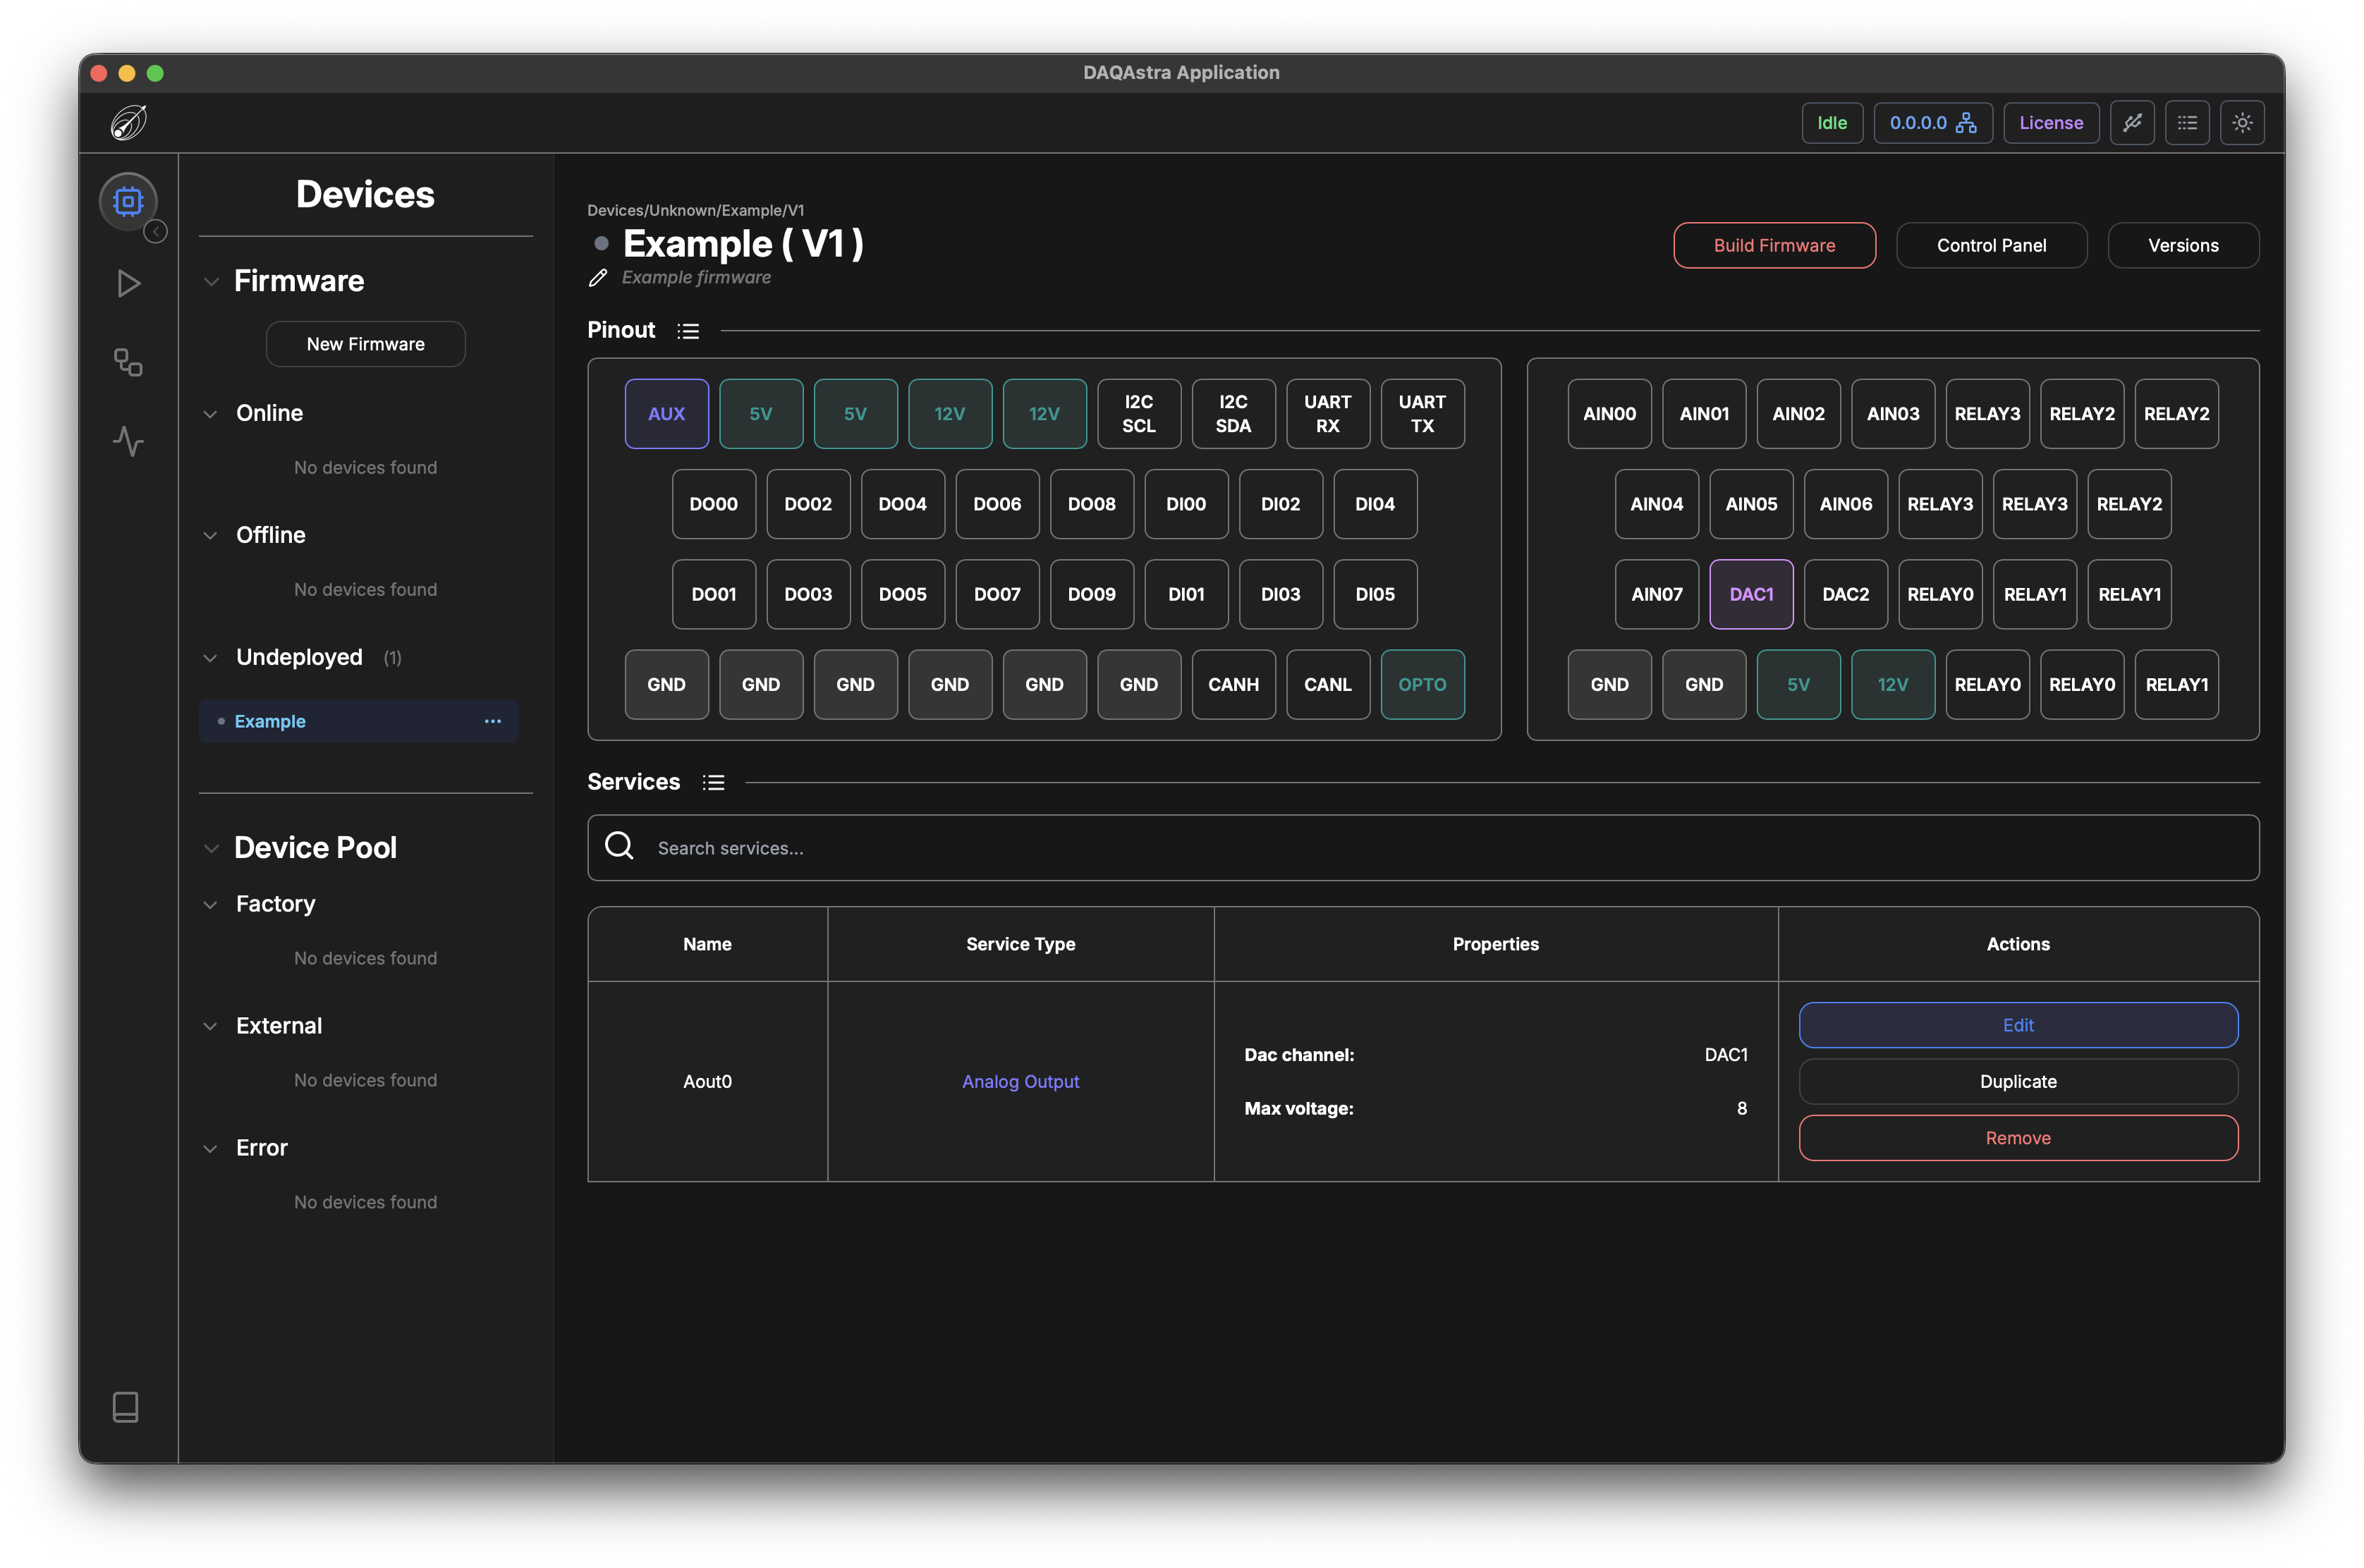
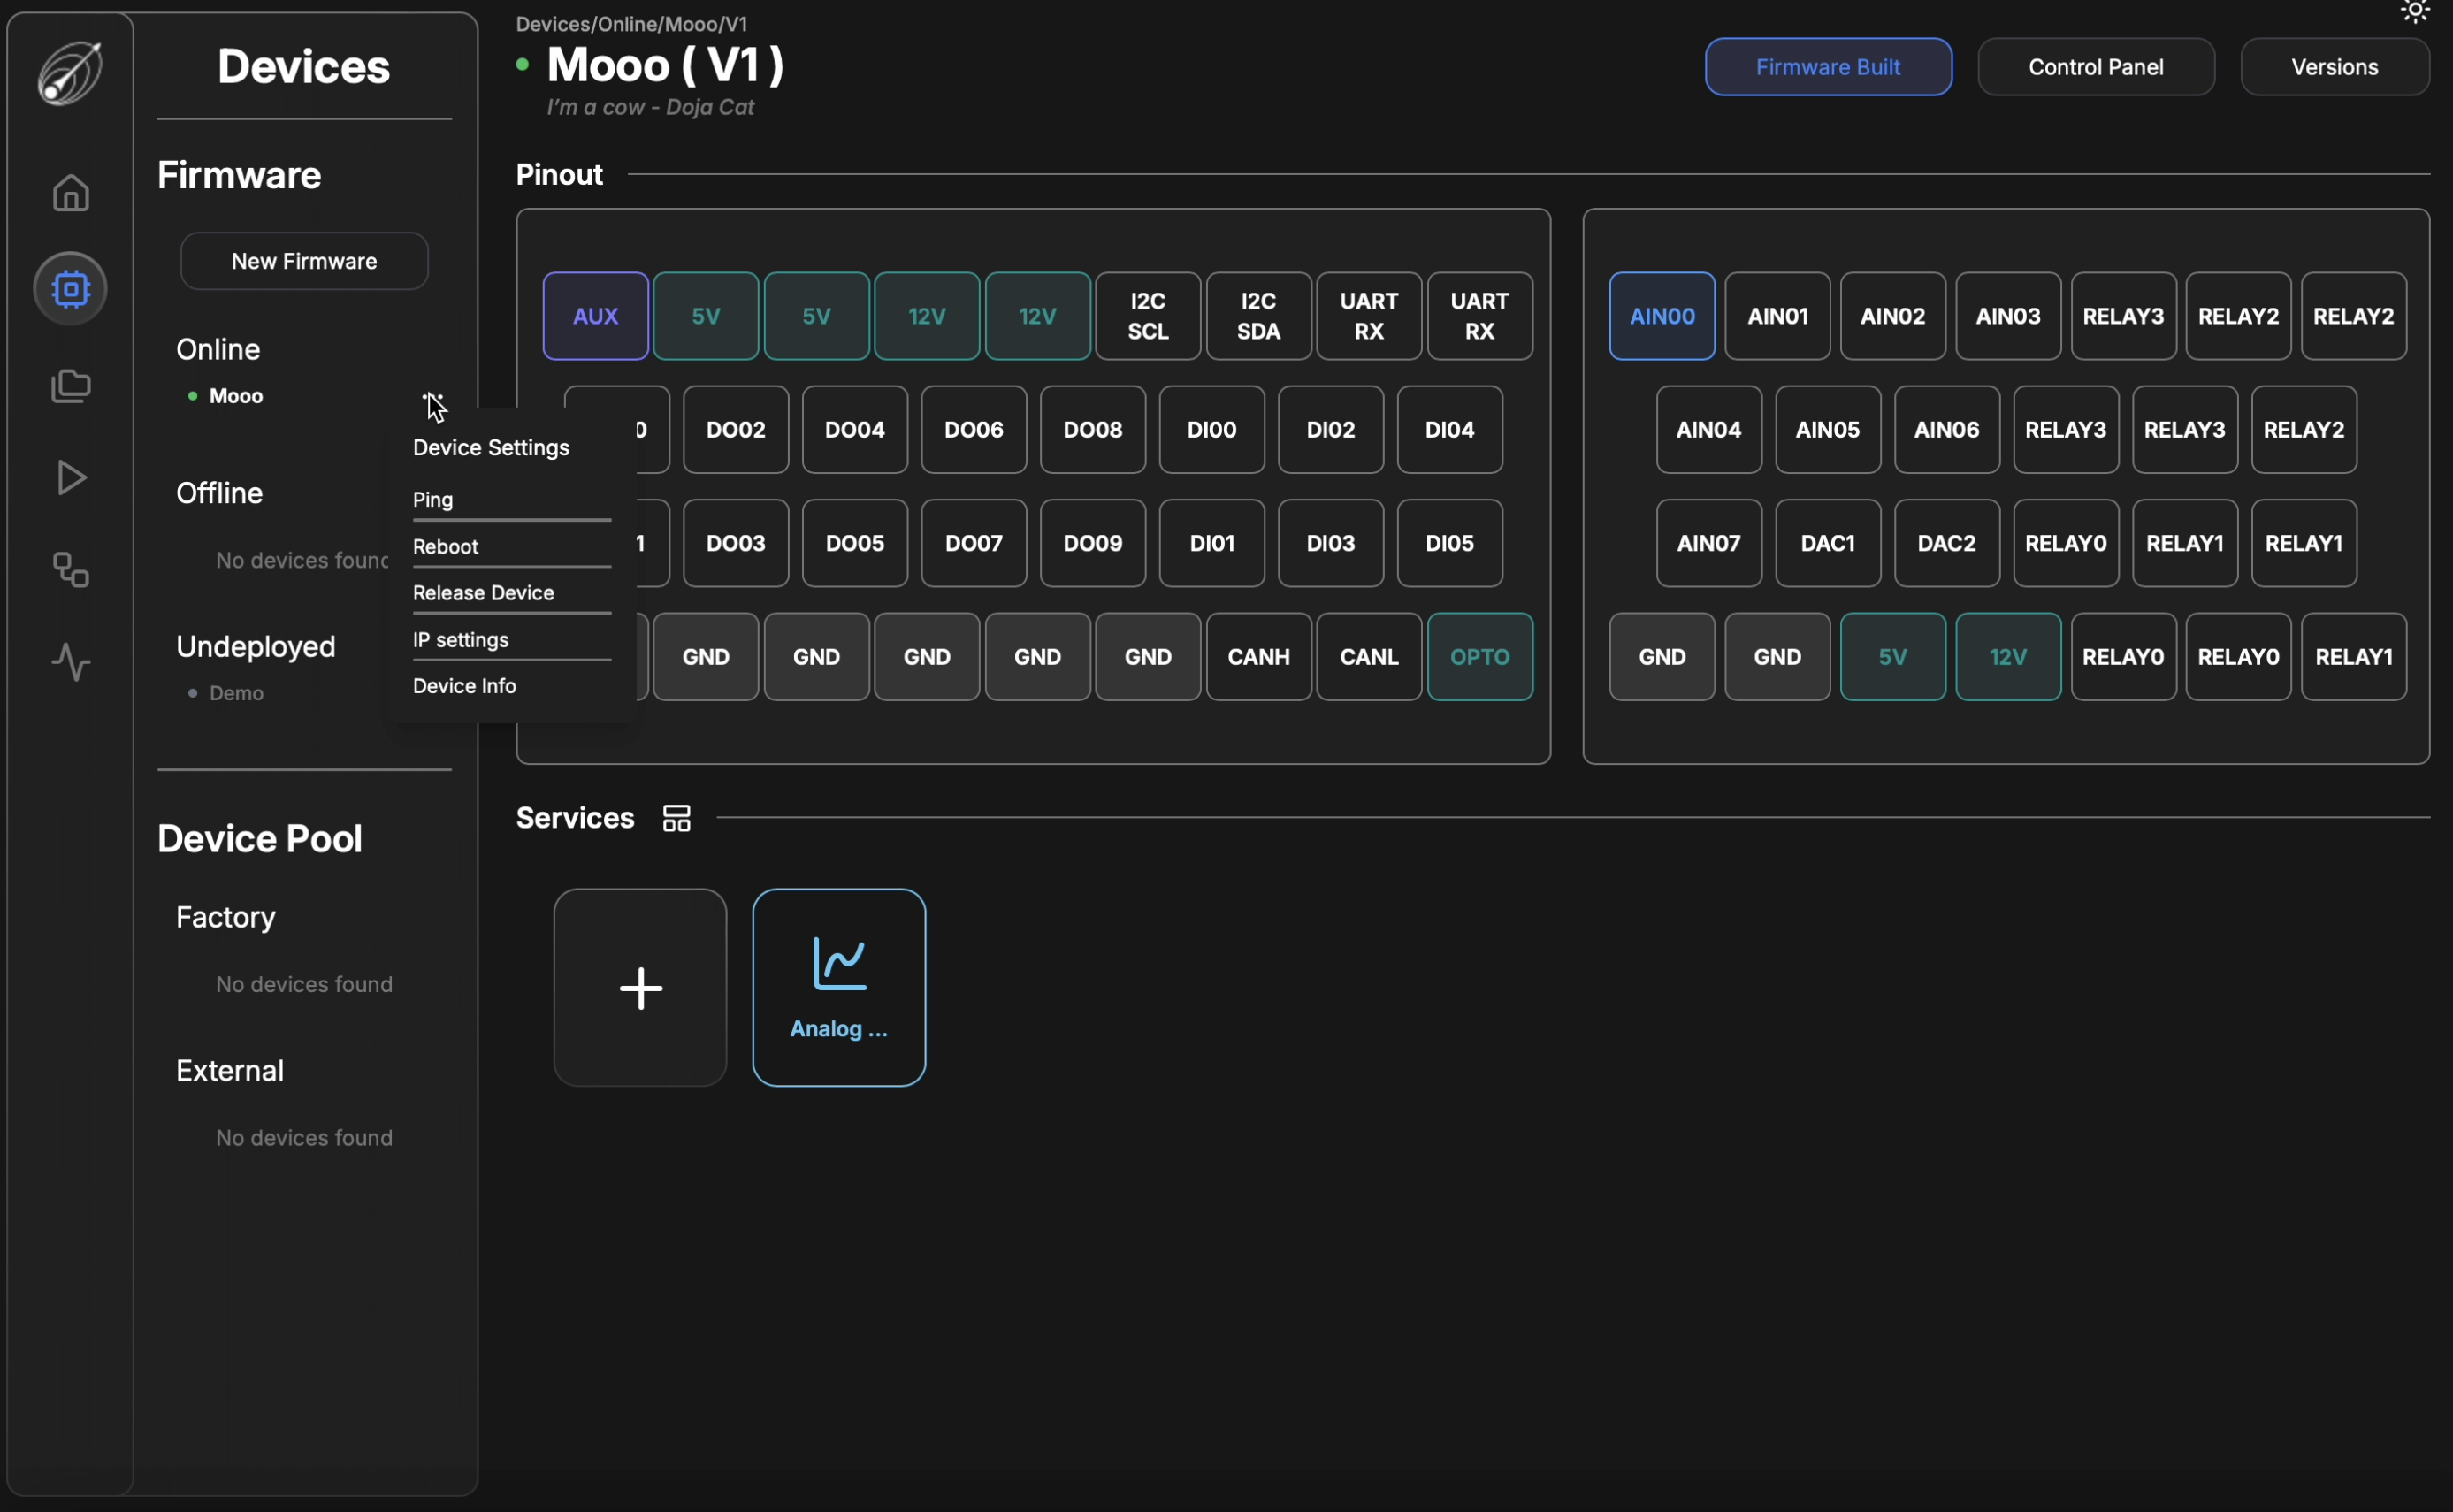
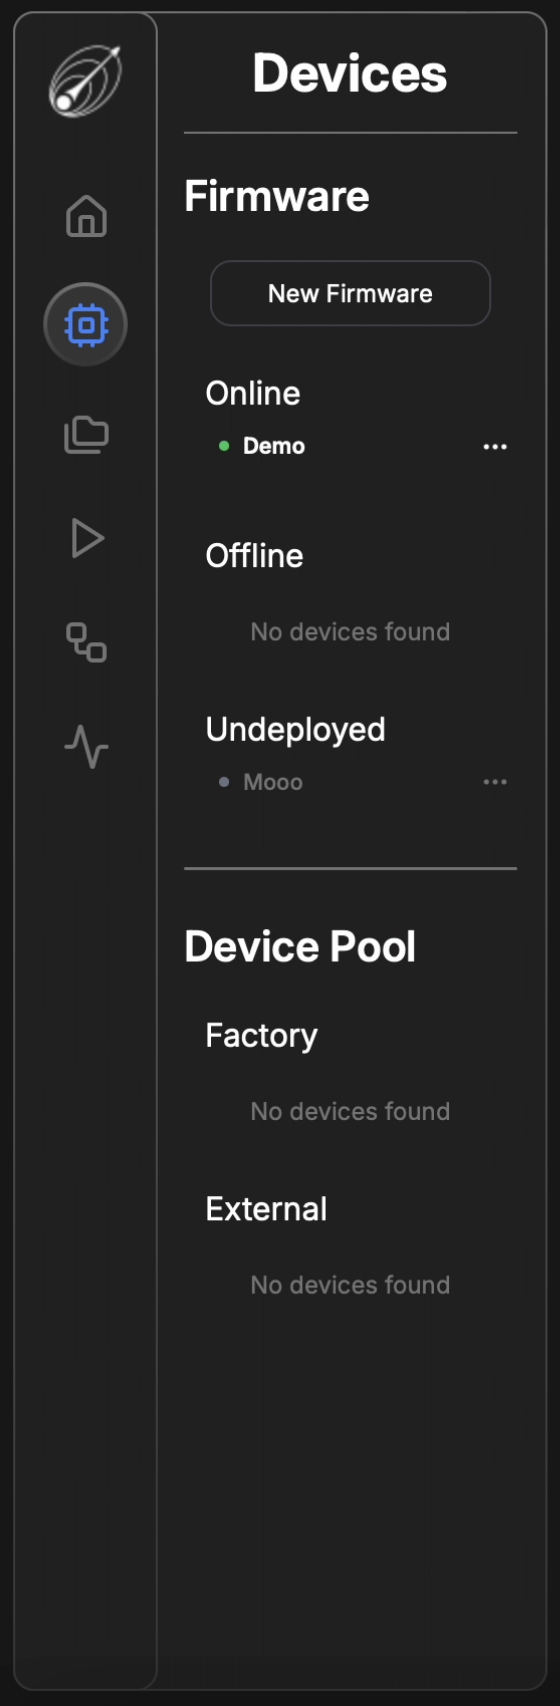
Before addressing how to connect and configure the DAQAstra hardware for your use-case, it is important to understand the key concepts and definitions used in the user-interface of this system. Shown below is a view of the Devices Page. This section will break down each part of this view and explain the nomenclature.
Starting with the left-hand side-panel. Each entry on the left-hand Devices panel is a Device, and a Device consists of two things.
1. DAQAstra Board
- Status: [Online, Offline, Doing OTA, External, Factory]
- Last Seen: timestamp
- IP Address: IPv4 Address
- MAC Address: EUI-48 globally unique address
- Hardware Version: The revision of hardware of this DAQAstra
- Serial Number: A unique serial number for the DAQAstra
2. Firmware
A configuration of a DAQAstra board.
- Name: The given name of the Firmware. The DAQAstra Board running this firmware will appear on the network with this name. There cannot be spaces in the name
- Version: An integer number for the version of the Firmware.
- Services: The interfaces that are enabled on the board by user-definition. The available service types are listed below. The definitions for each service will be covered in a later section.
- Analog Input
- Digital Input
- Frequency Counter
- Analog Output
- Digital Output
- PWM Output
- Complementary PWM
- PID Controller
- Bang-Bang Controller
- Stepper Motor Controller
- Inertial Measurement Unit
- Magnetometer
- IR Camera
- Loadcell
- Thermocouple
- Generic Actuator
- Stateful Actuator
- Math Channel
- Command
- Control Panel: A Generated dashboard for controlling the Services defined in this Firmware.
- Description: A short (<30 word) description of what the Firmware does.
- Comment: Commit messages, essentially. When a firmware is edited, the user may define a comment that is associated with that specific edit.
DAQAstra Interface
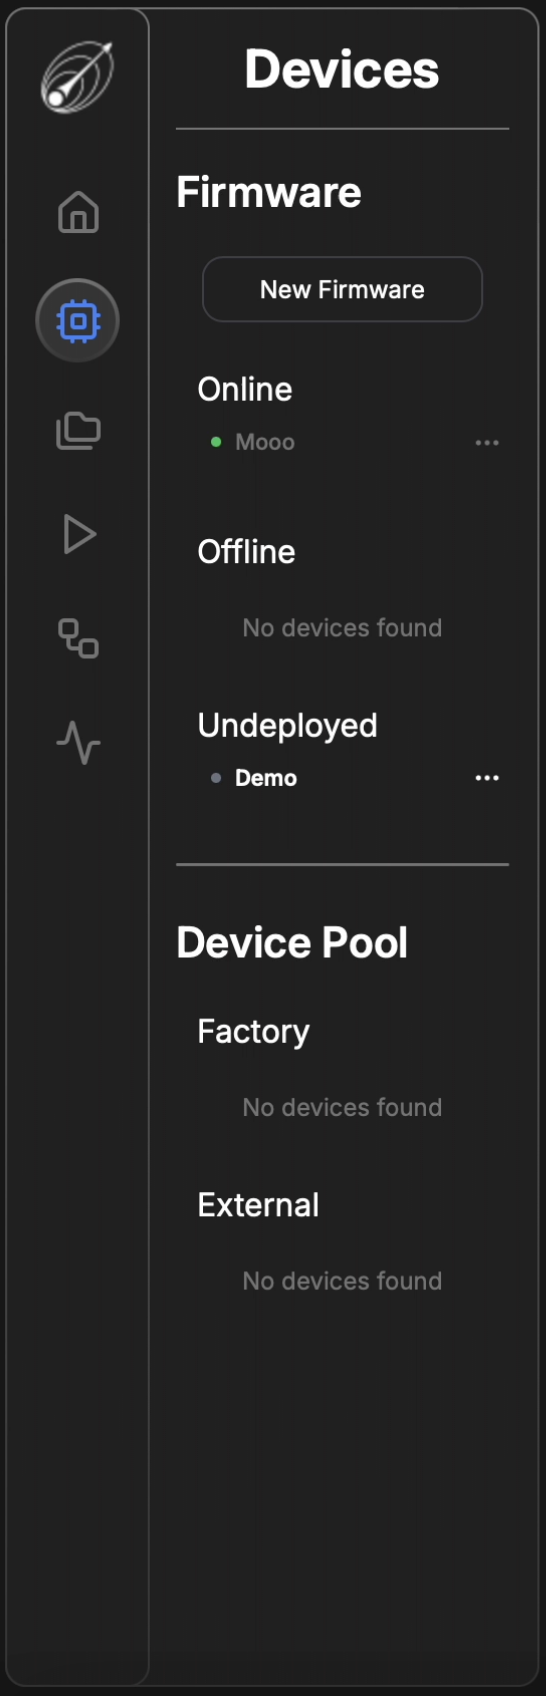
Now that the elements of a Device are known, each category in the side-panel can be defined:
- Online: A
DAQAstra Boardthat is currently connected to the application and running a knownFirmware. - Offline: A
DAQAstra Boardthat previously was connected to the application running a knownFirmware. - Undeployed: A
Firmwarethat has not been allocated to aDAQAstra Board. It is available to be deployed onto aFactoryDevice. - Factory: A
DAQAstra Boardwith the stockFirmware(almost all interfaces turned on and running). It is available to have aFirmwaredeployed to it. - External: An online
DAQAstra Boardwith an unrecognizedFirmware(likely from a different application instance). The user may choose to build the unknownFirmwaretherefore making it known and moving theExternaldevice toOnline.
Right-clicking (or clicking on the three dots) will open the selected DAQAstra's Device Settings menu.
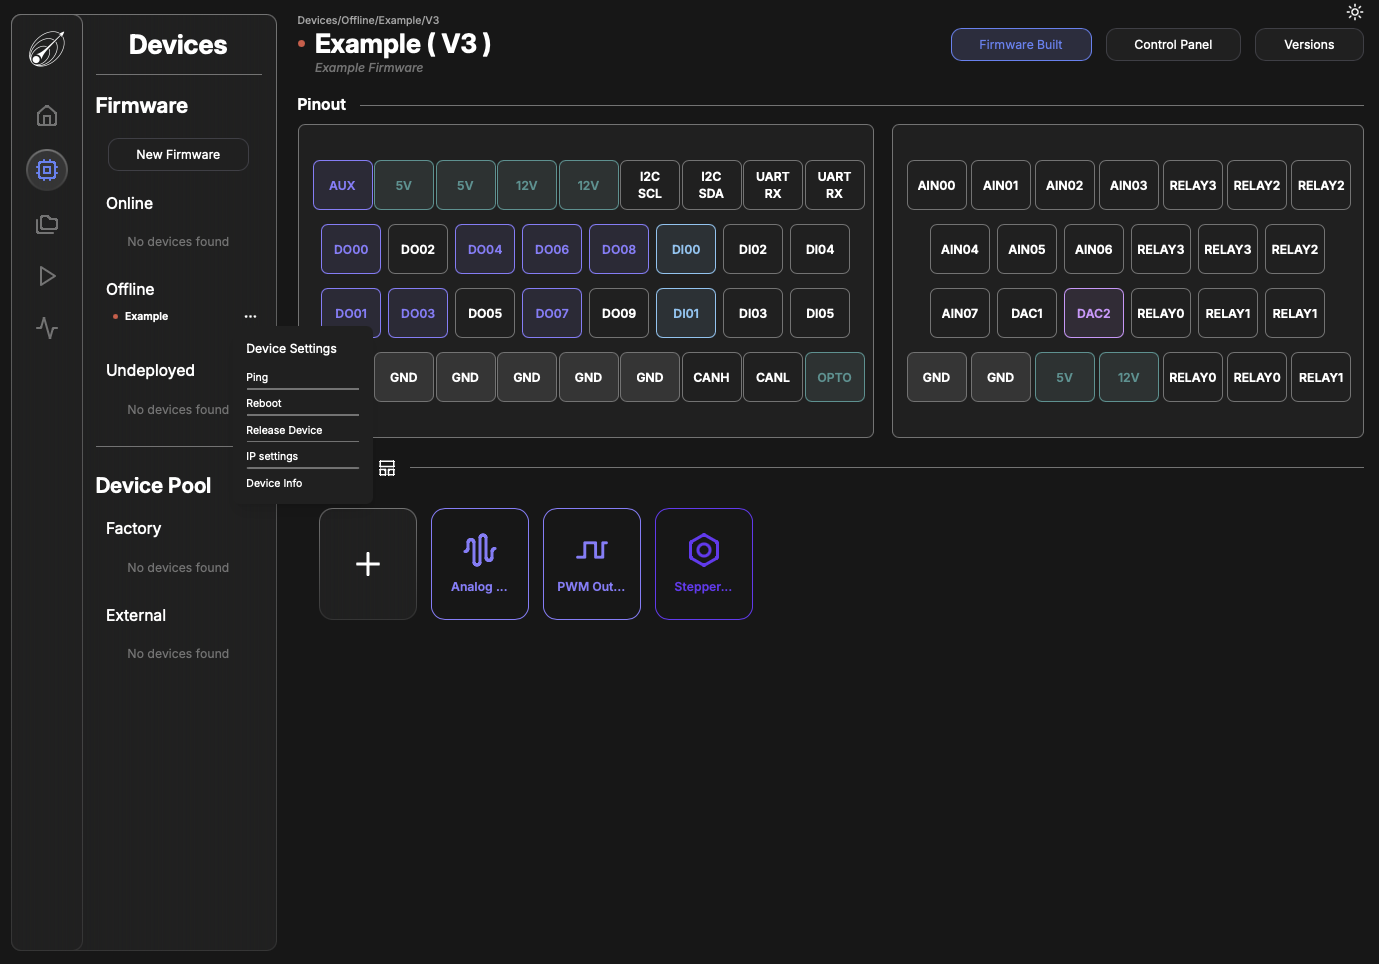
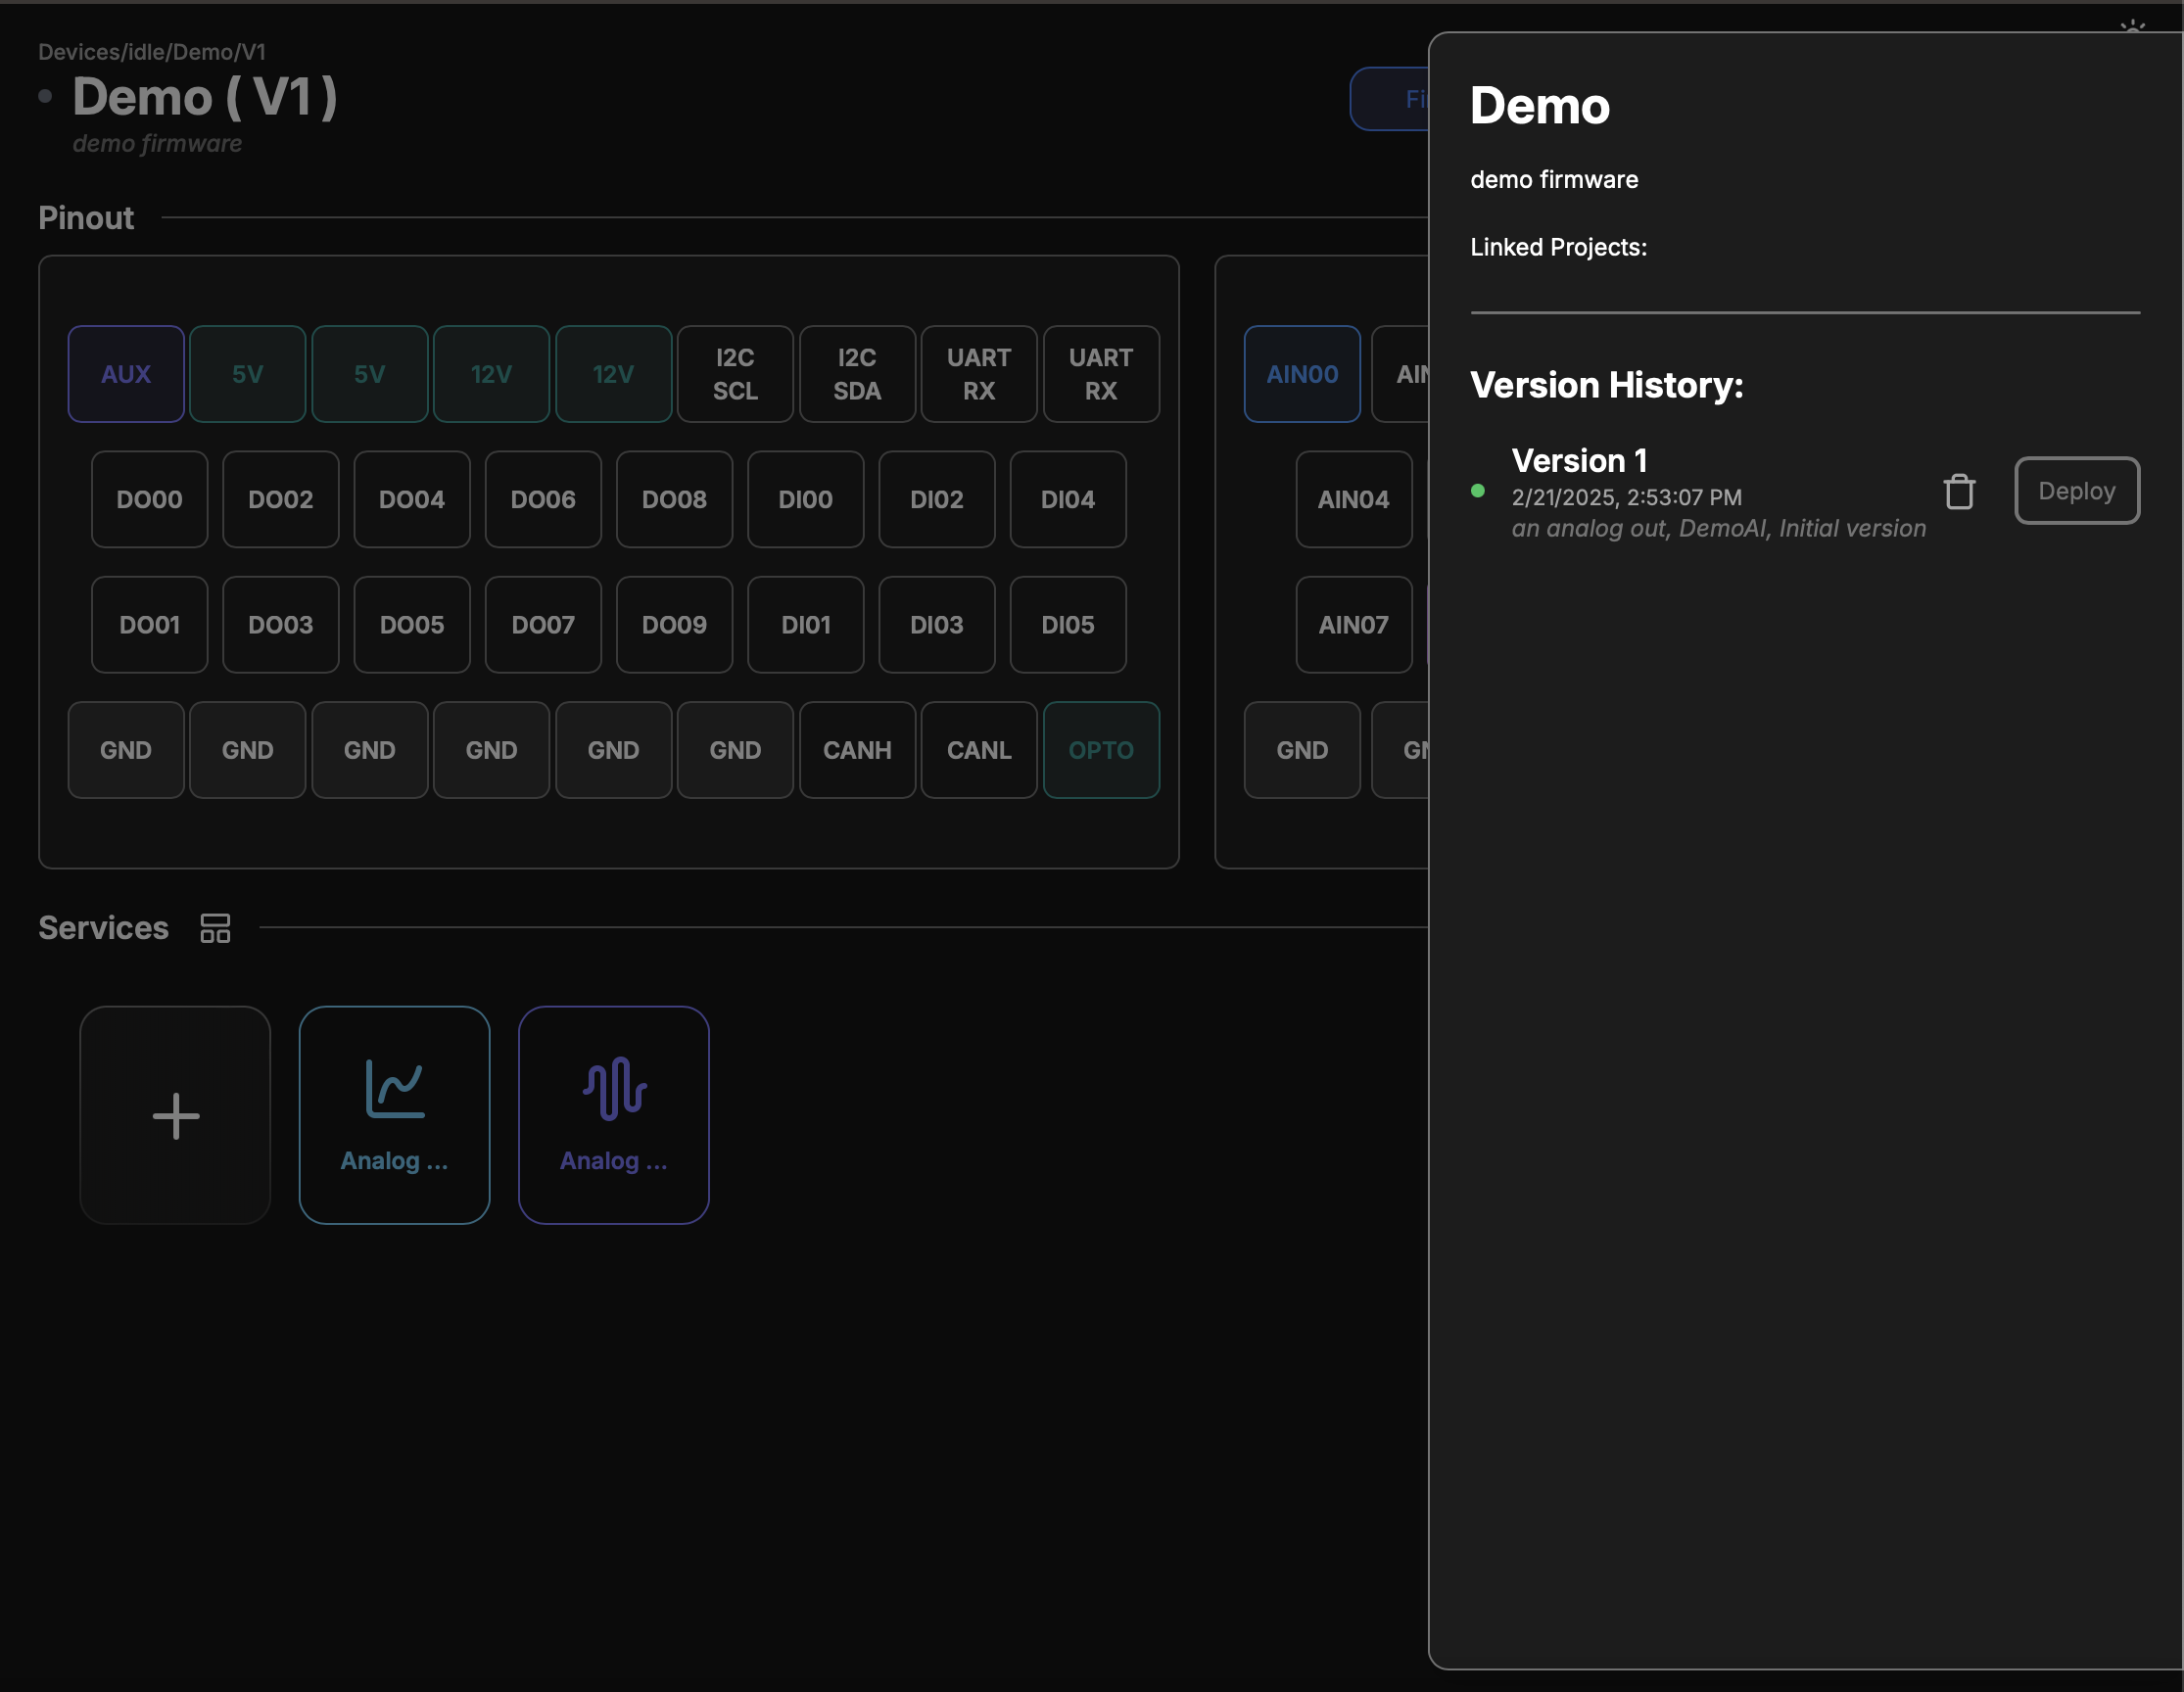
Pingwill send a ping message to the selected DAQAstraRebootwill send a reboot command to the selected DAQAstraRelease Devicewill trigger an over-the-air (OTA) update that will return the DAQAstra toFactory Defaultfirmware, making it available in theDevice Poolas a possible target to deploy anUndeployed Firmware. The firmware previously on the DAQAstra will return to the Undeployed category and may be deployed to any available DAQAstra boards in theDevice Pool.IP Settingsallows configuration of the selected DAQAstra's default static IPv4 address.Device Infoshows the dialogue in the image below. This is available when the DAQAstra is offline, too.
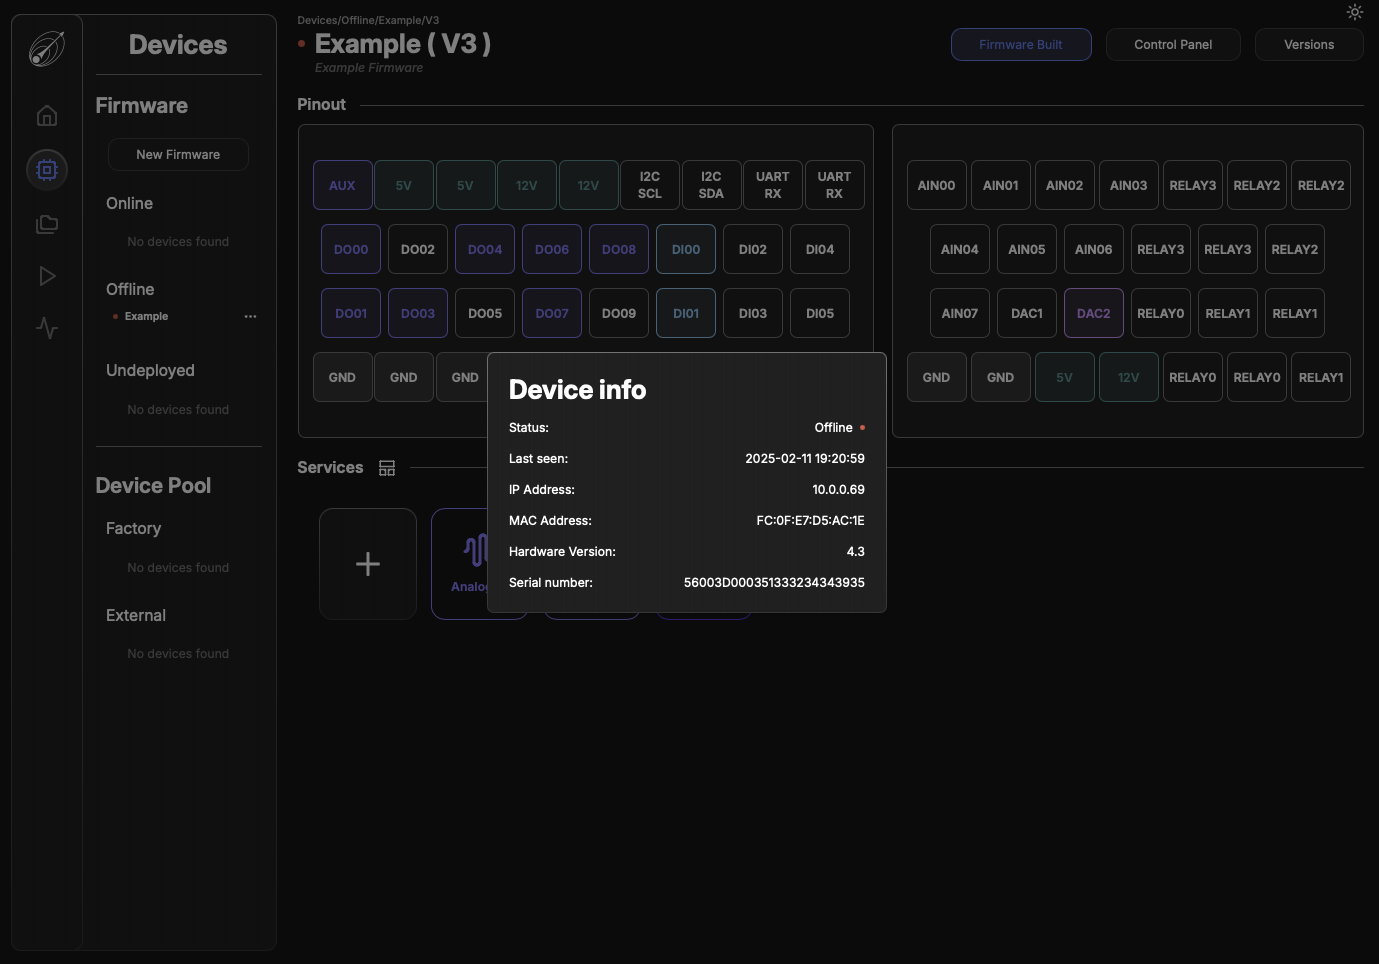
This information represents real-world DAQAstra hardware and the fields shown are populated upon a board's connection to the application server. When a DAQAstra is online and connected to the application, the user can send commands and manipulate a DAQAstra board directly via this menu.
Note that should a DAQAstra become unavailable for the foreseeable future while it has a deployed firmware on it, the
Device Settingsright-click menu has aDelete Deviceoption that appears for offline devices only. Deleting the device will return the firmware to theUndeployedsection where it can be redeployed to another device.
Firmware Interface
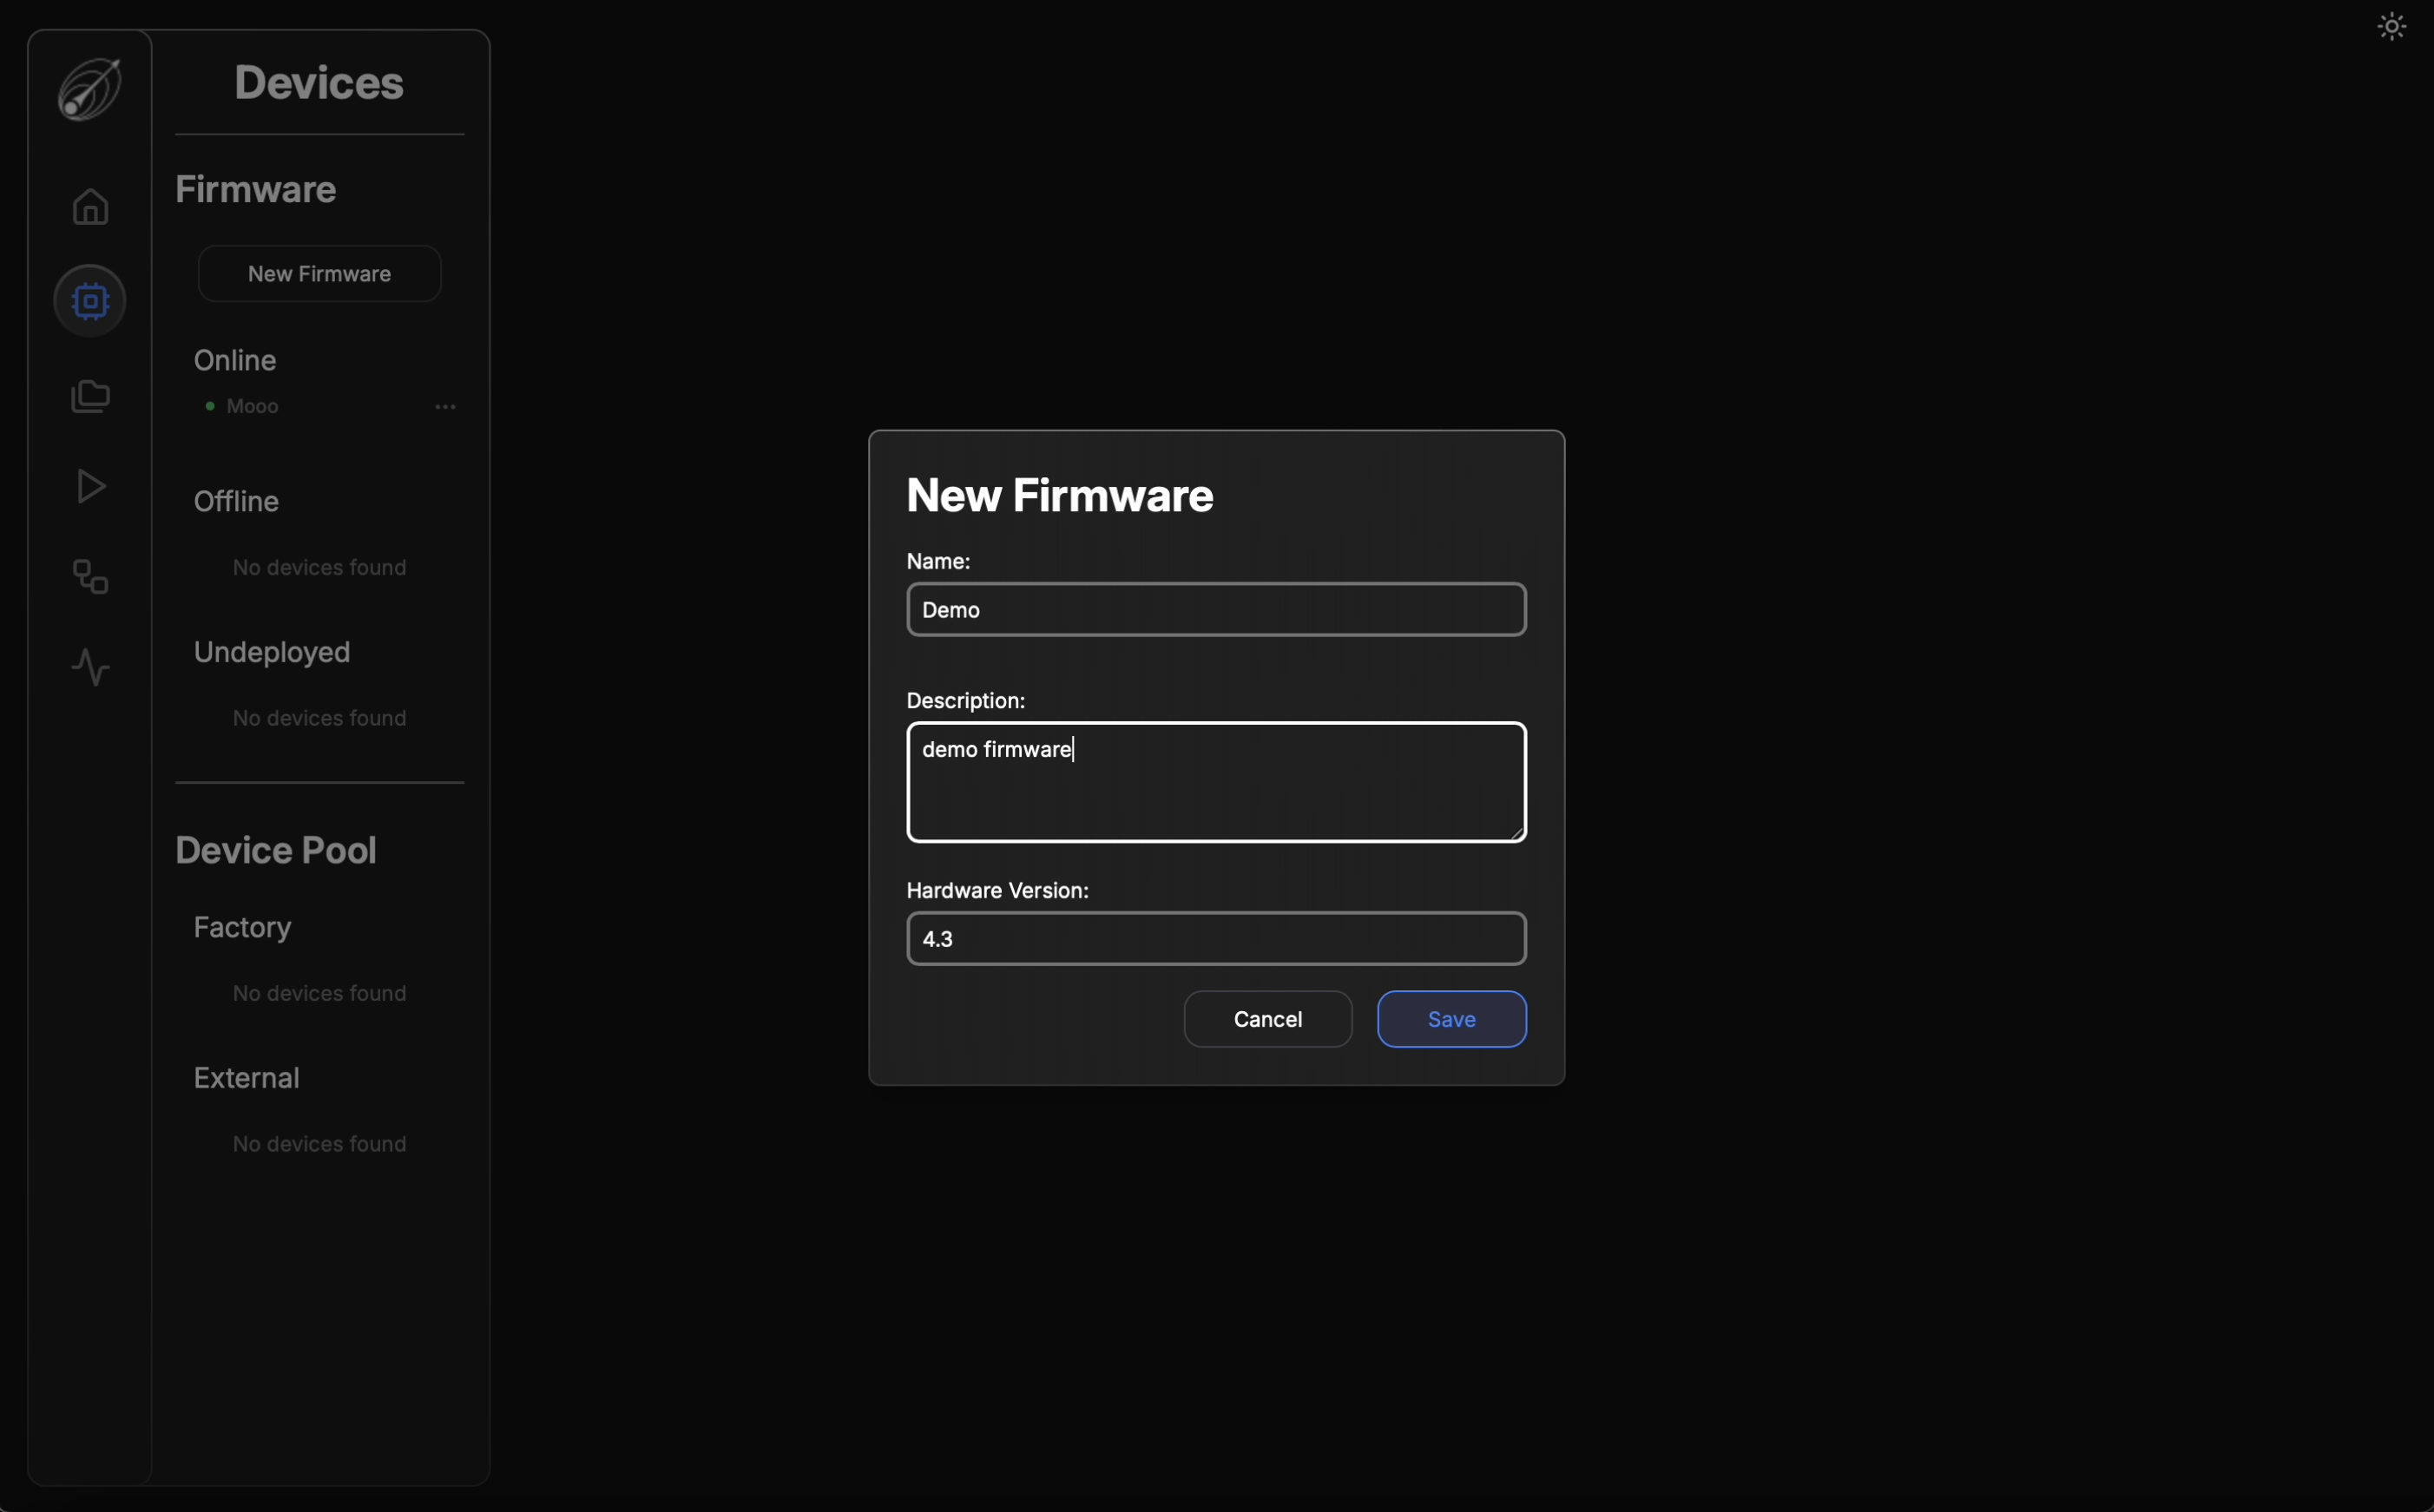
A new firmware can be created by clicking the New Firmware button at the top of the side panel.
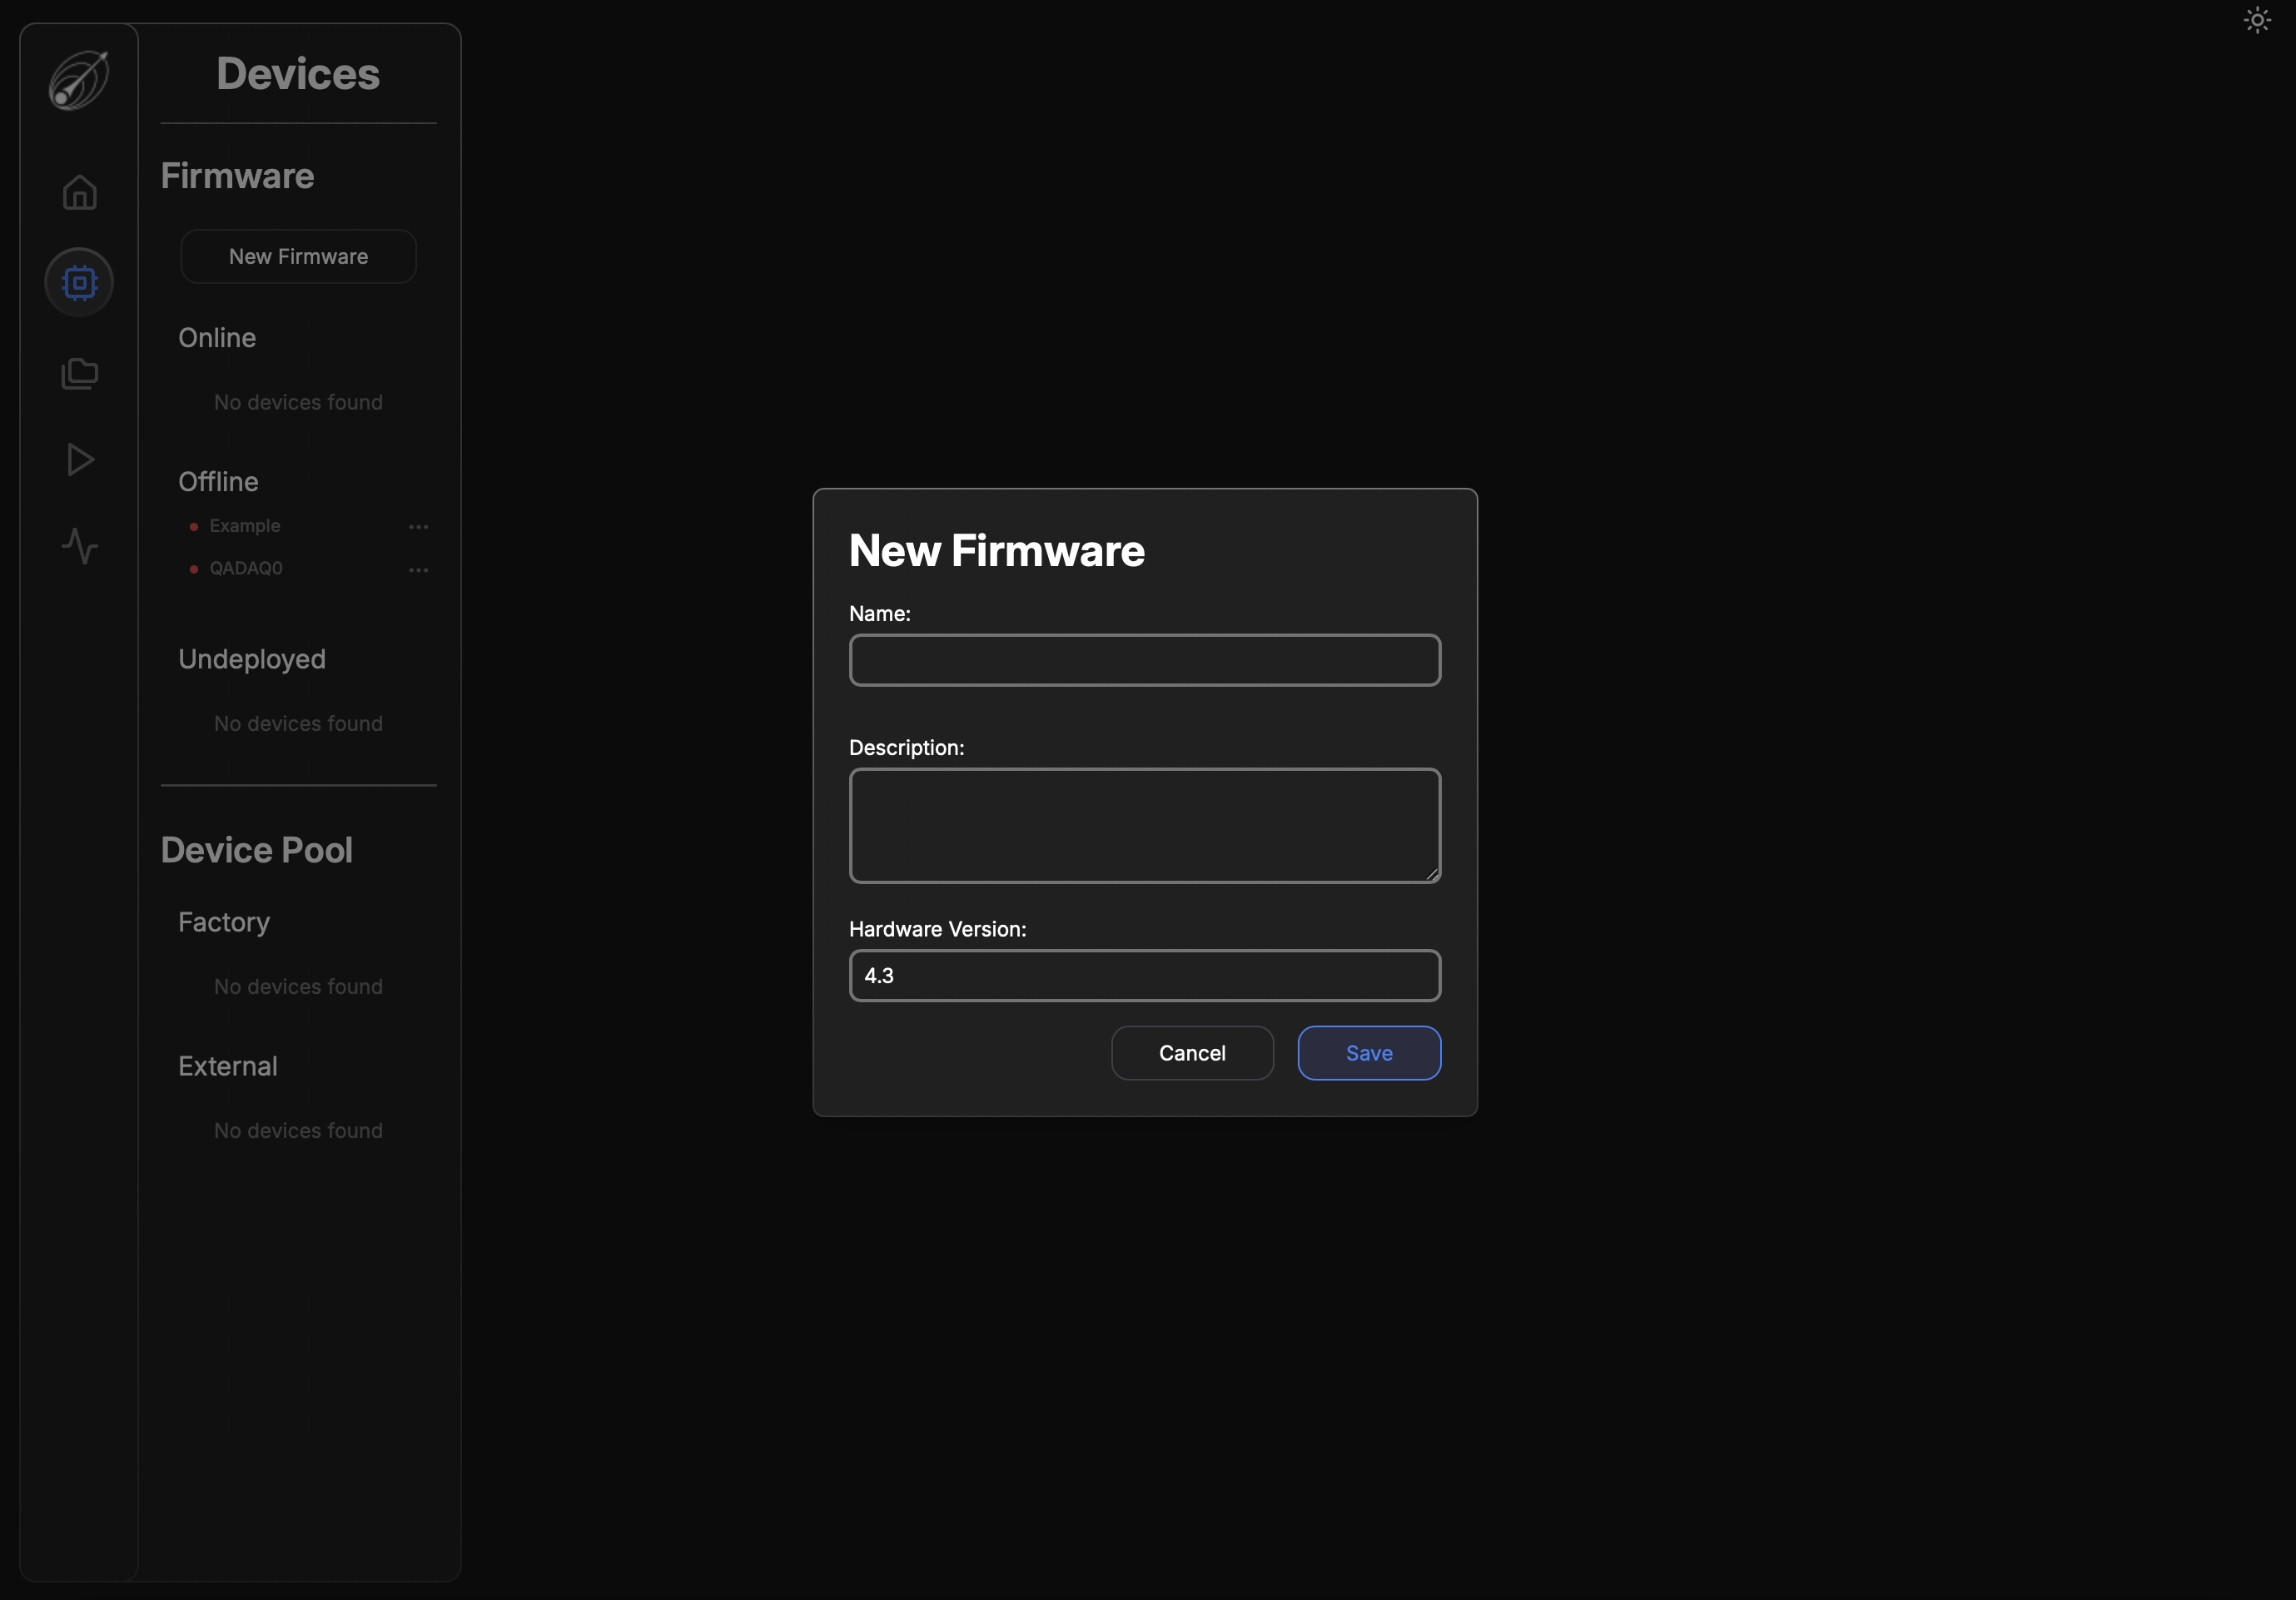
A firmware requires just three things to start, a name with no spaces, a short description that would be useful for other operators to understand the purpose of this firmware, and the version of DAQAstra hardware you're planning to deploy.
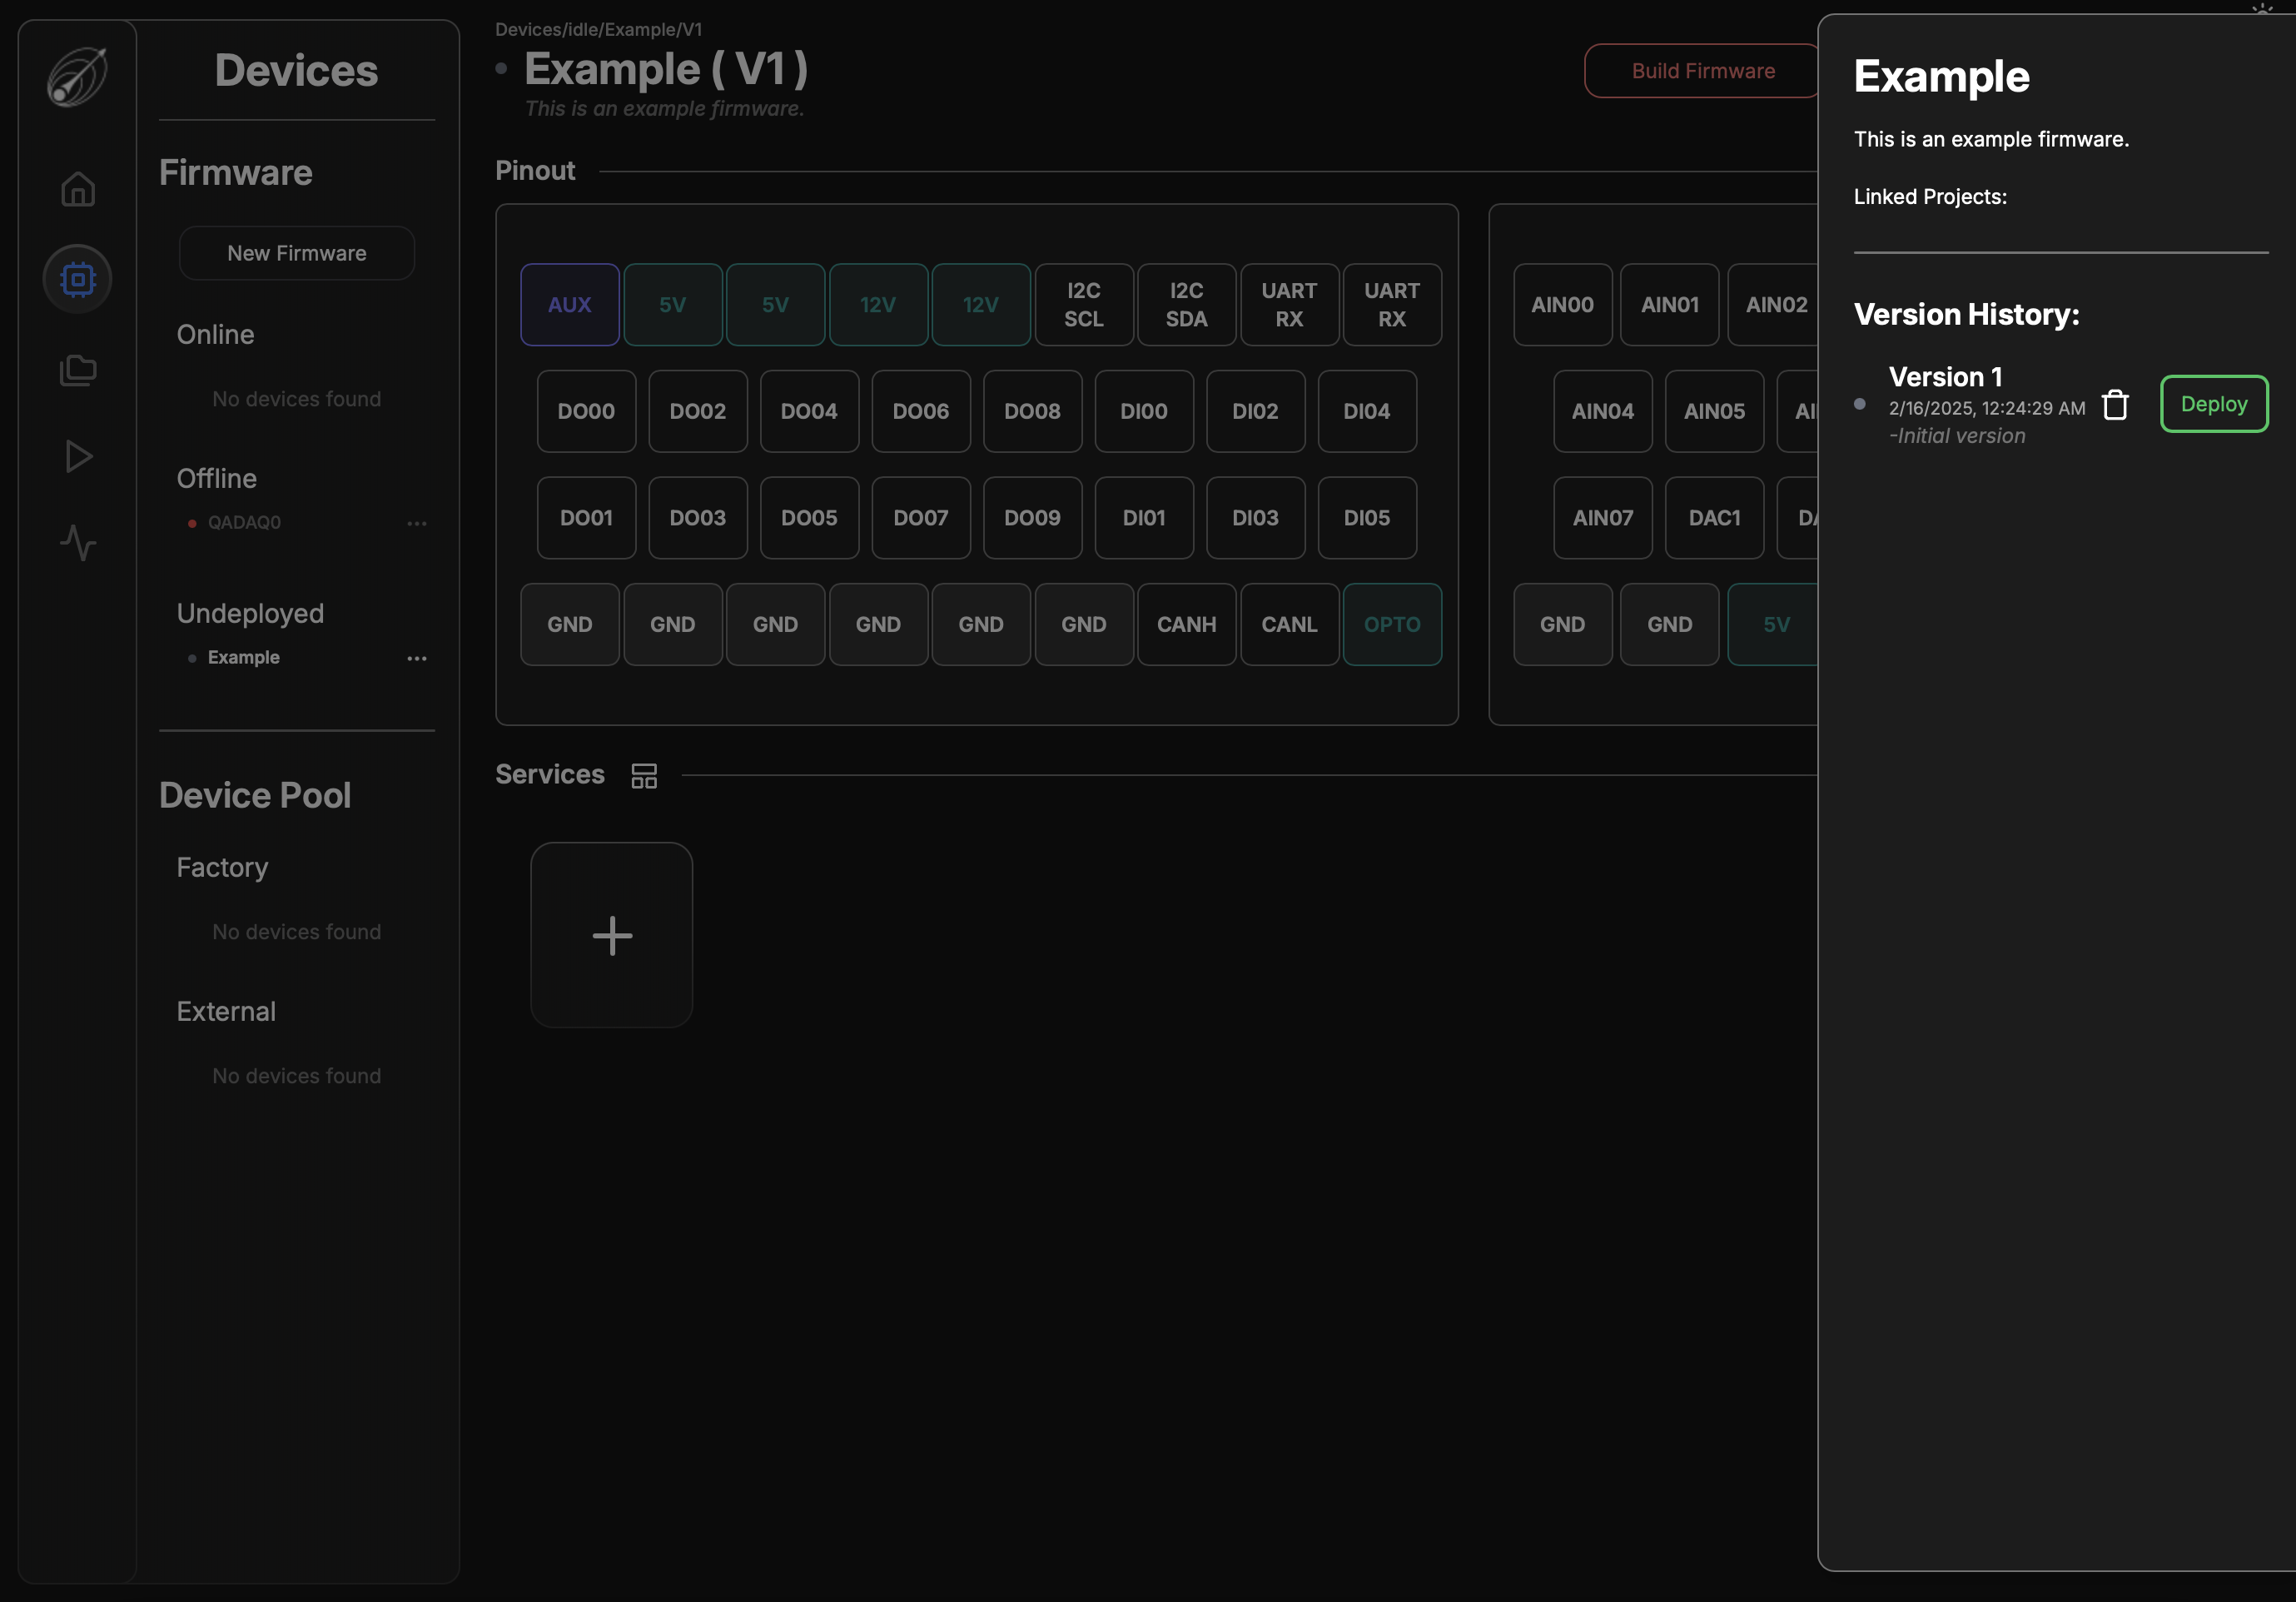
After creating the new firmware, you can select it from the Undeployed section on the side-panel. At the top of this panel, the selected Firmware's Name, Version , and description are displayed in the top-left corner. The Firmware Built button is an indicator of whether the version of the firmware being displayed has been built by the application's builder service. If edits are made and a new version of the firmware file has not been built the button will appear red. Otherwise, it will be blue. The Build Firmware and the Control Panel button are be covered in greater depth in Operations.

The Version button opens a drawer that displays all of the versions of the selected Firmware. Each entry incudes the version number, the date and time of creation, and the comment made by the user describing the changes made. Each version is selectable and changing the selection will update the Firmware panel contents to the newly selected version.
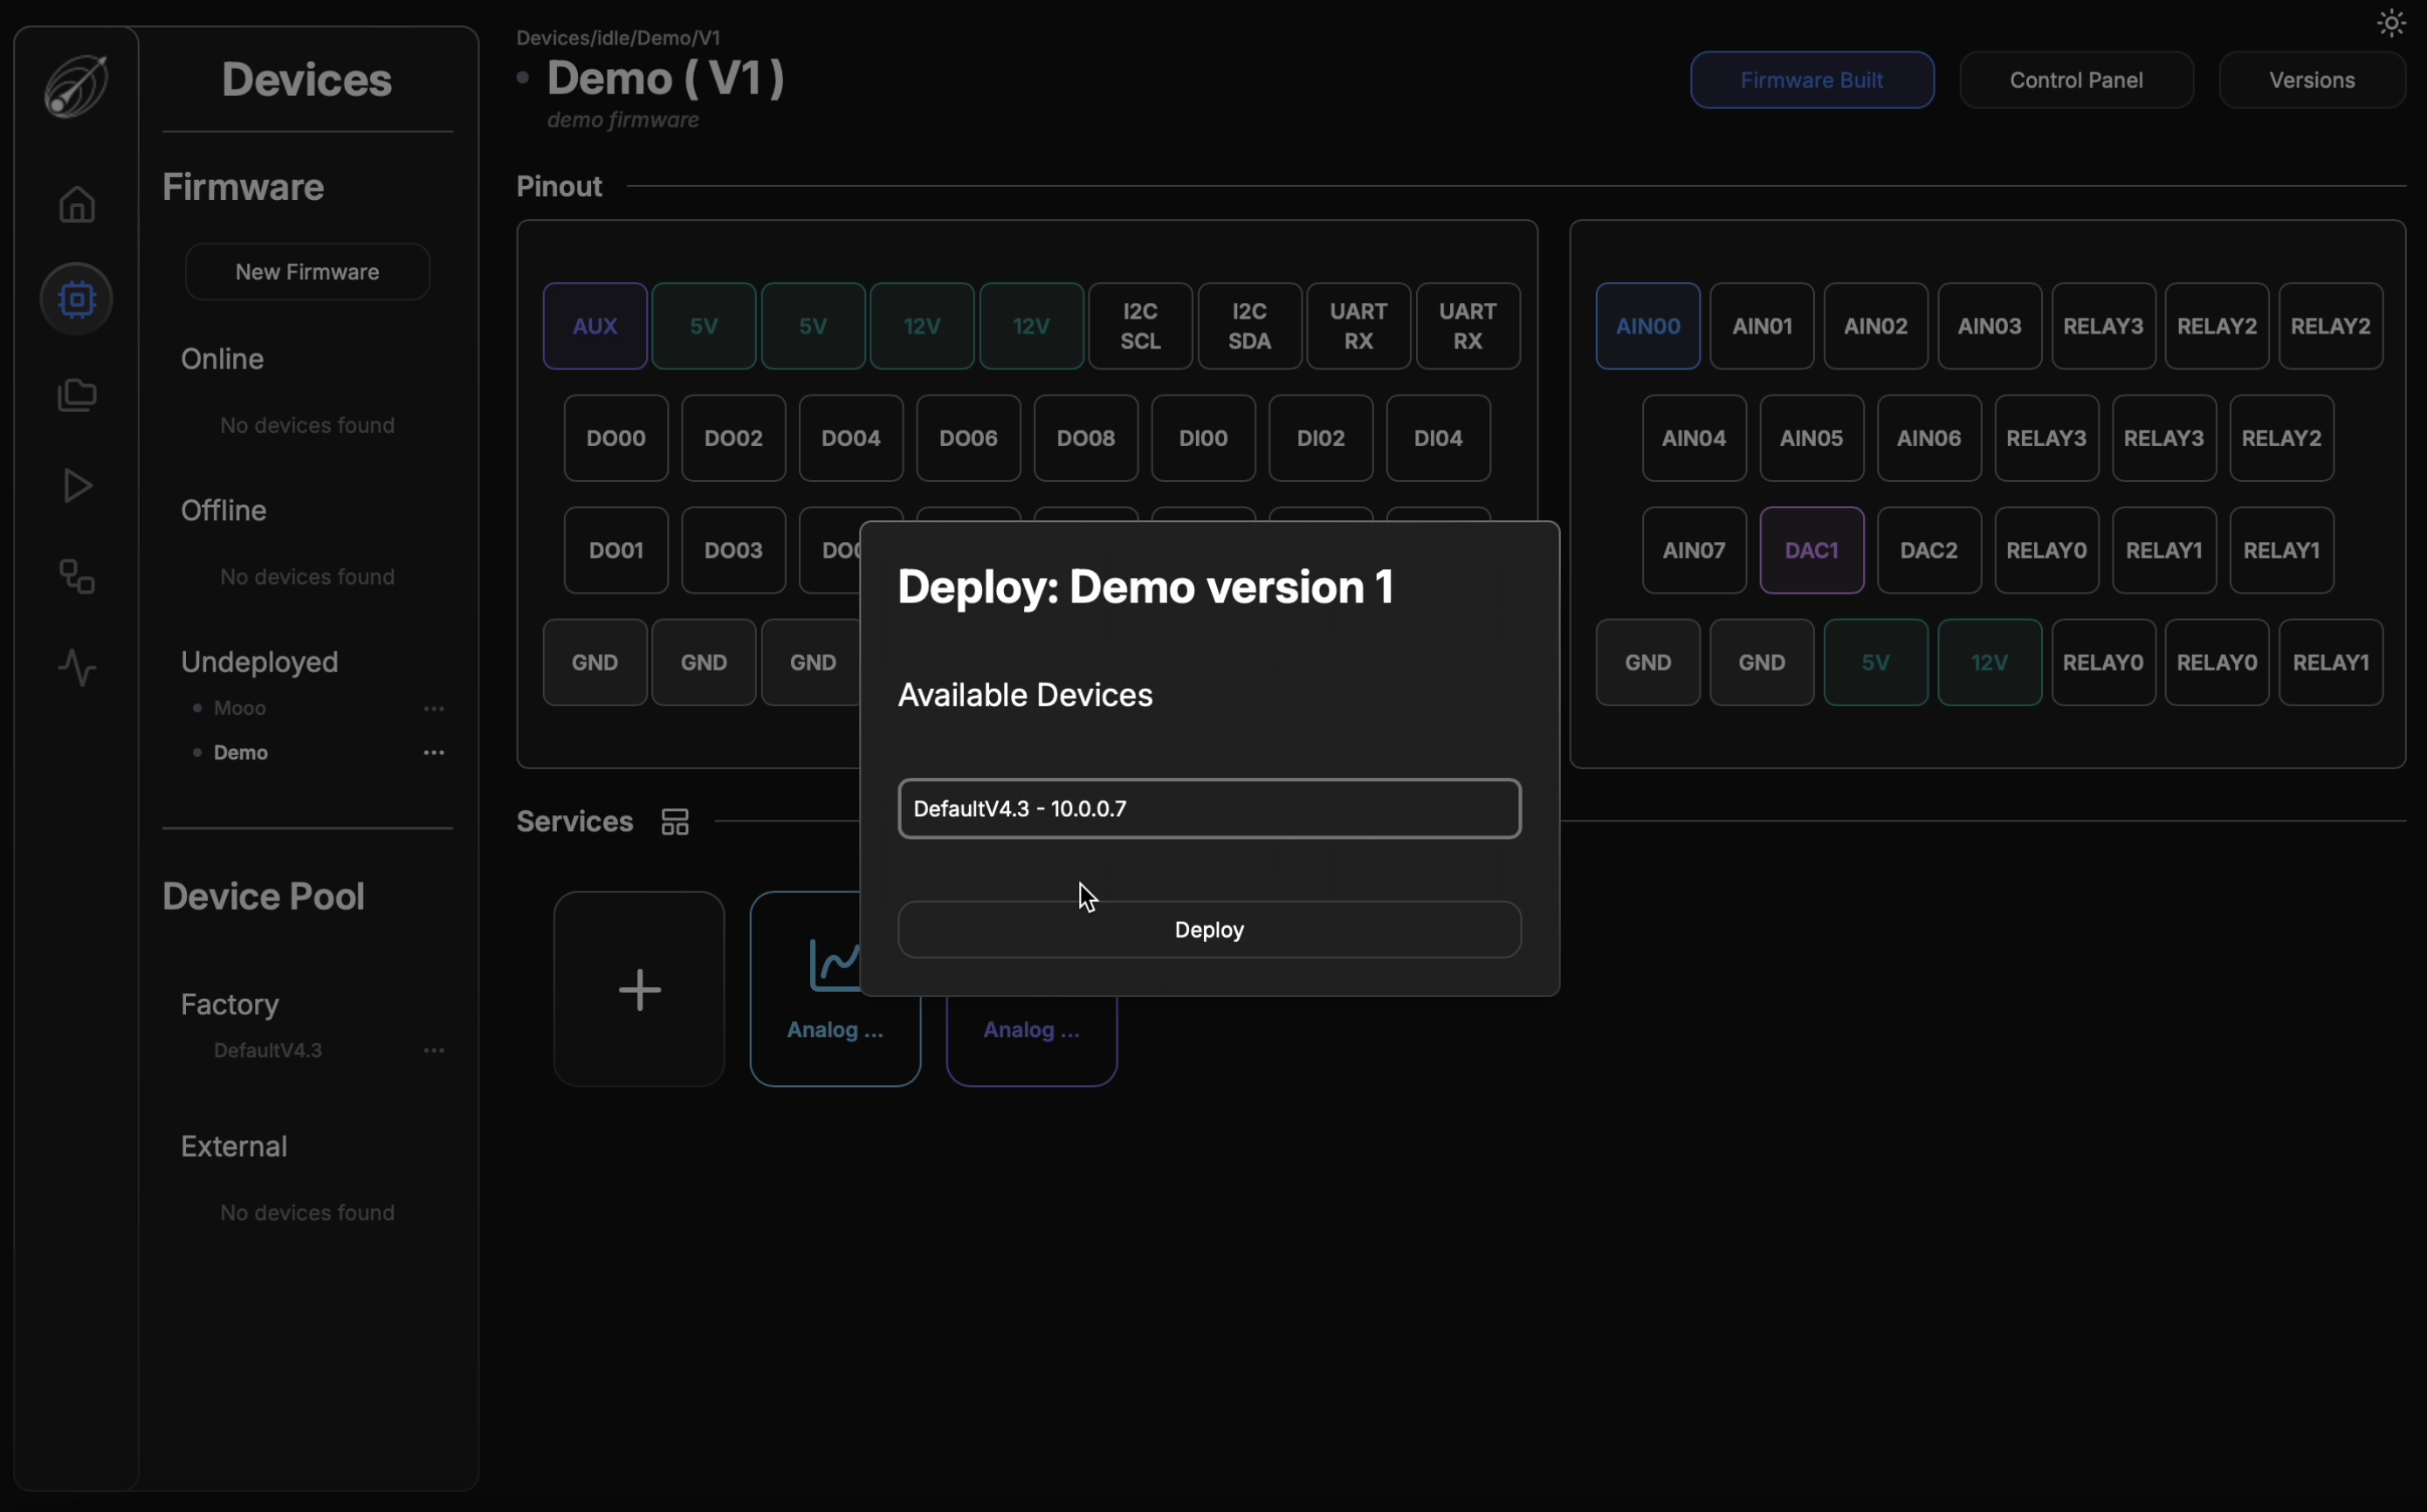
Clicking Deploy, assuming the DAQAstra running this Firmware is online, will trigger an OTA update to change the version running on the DAQAstra to the selected version. The trash button will delete the selected firmware version assuming it is not currently in use.
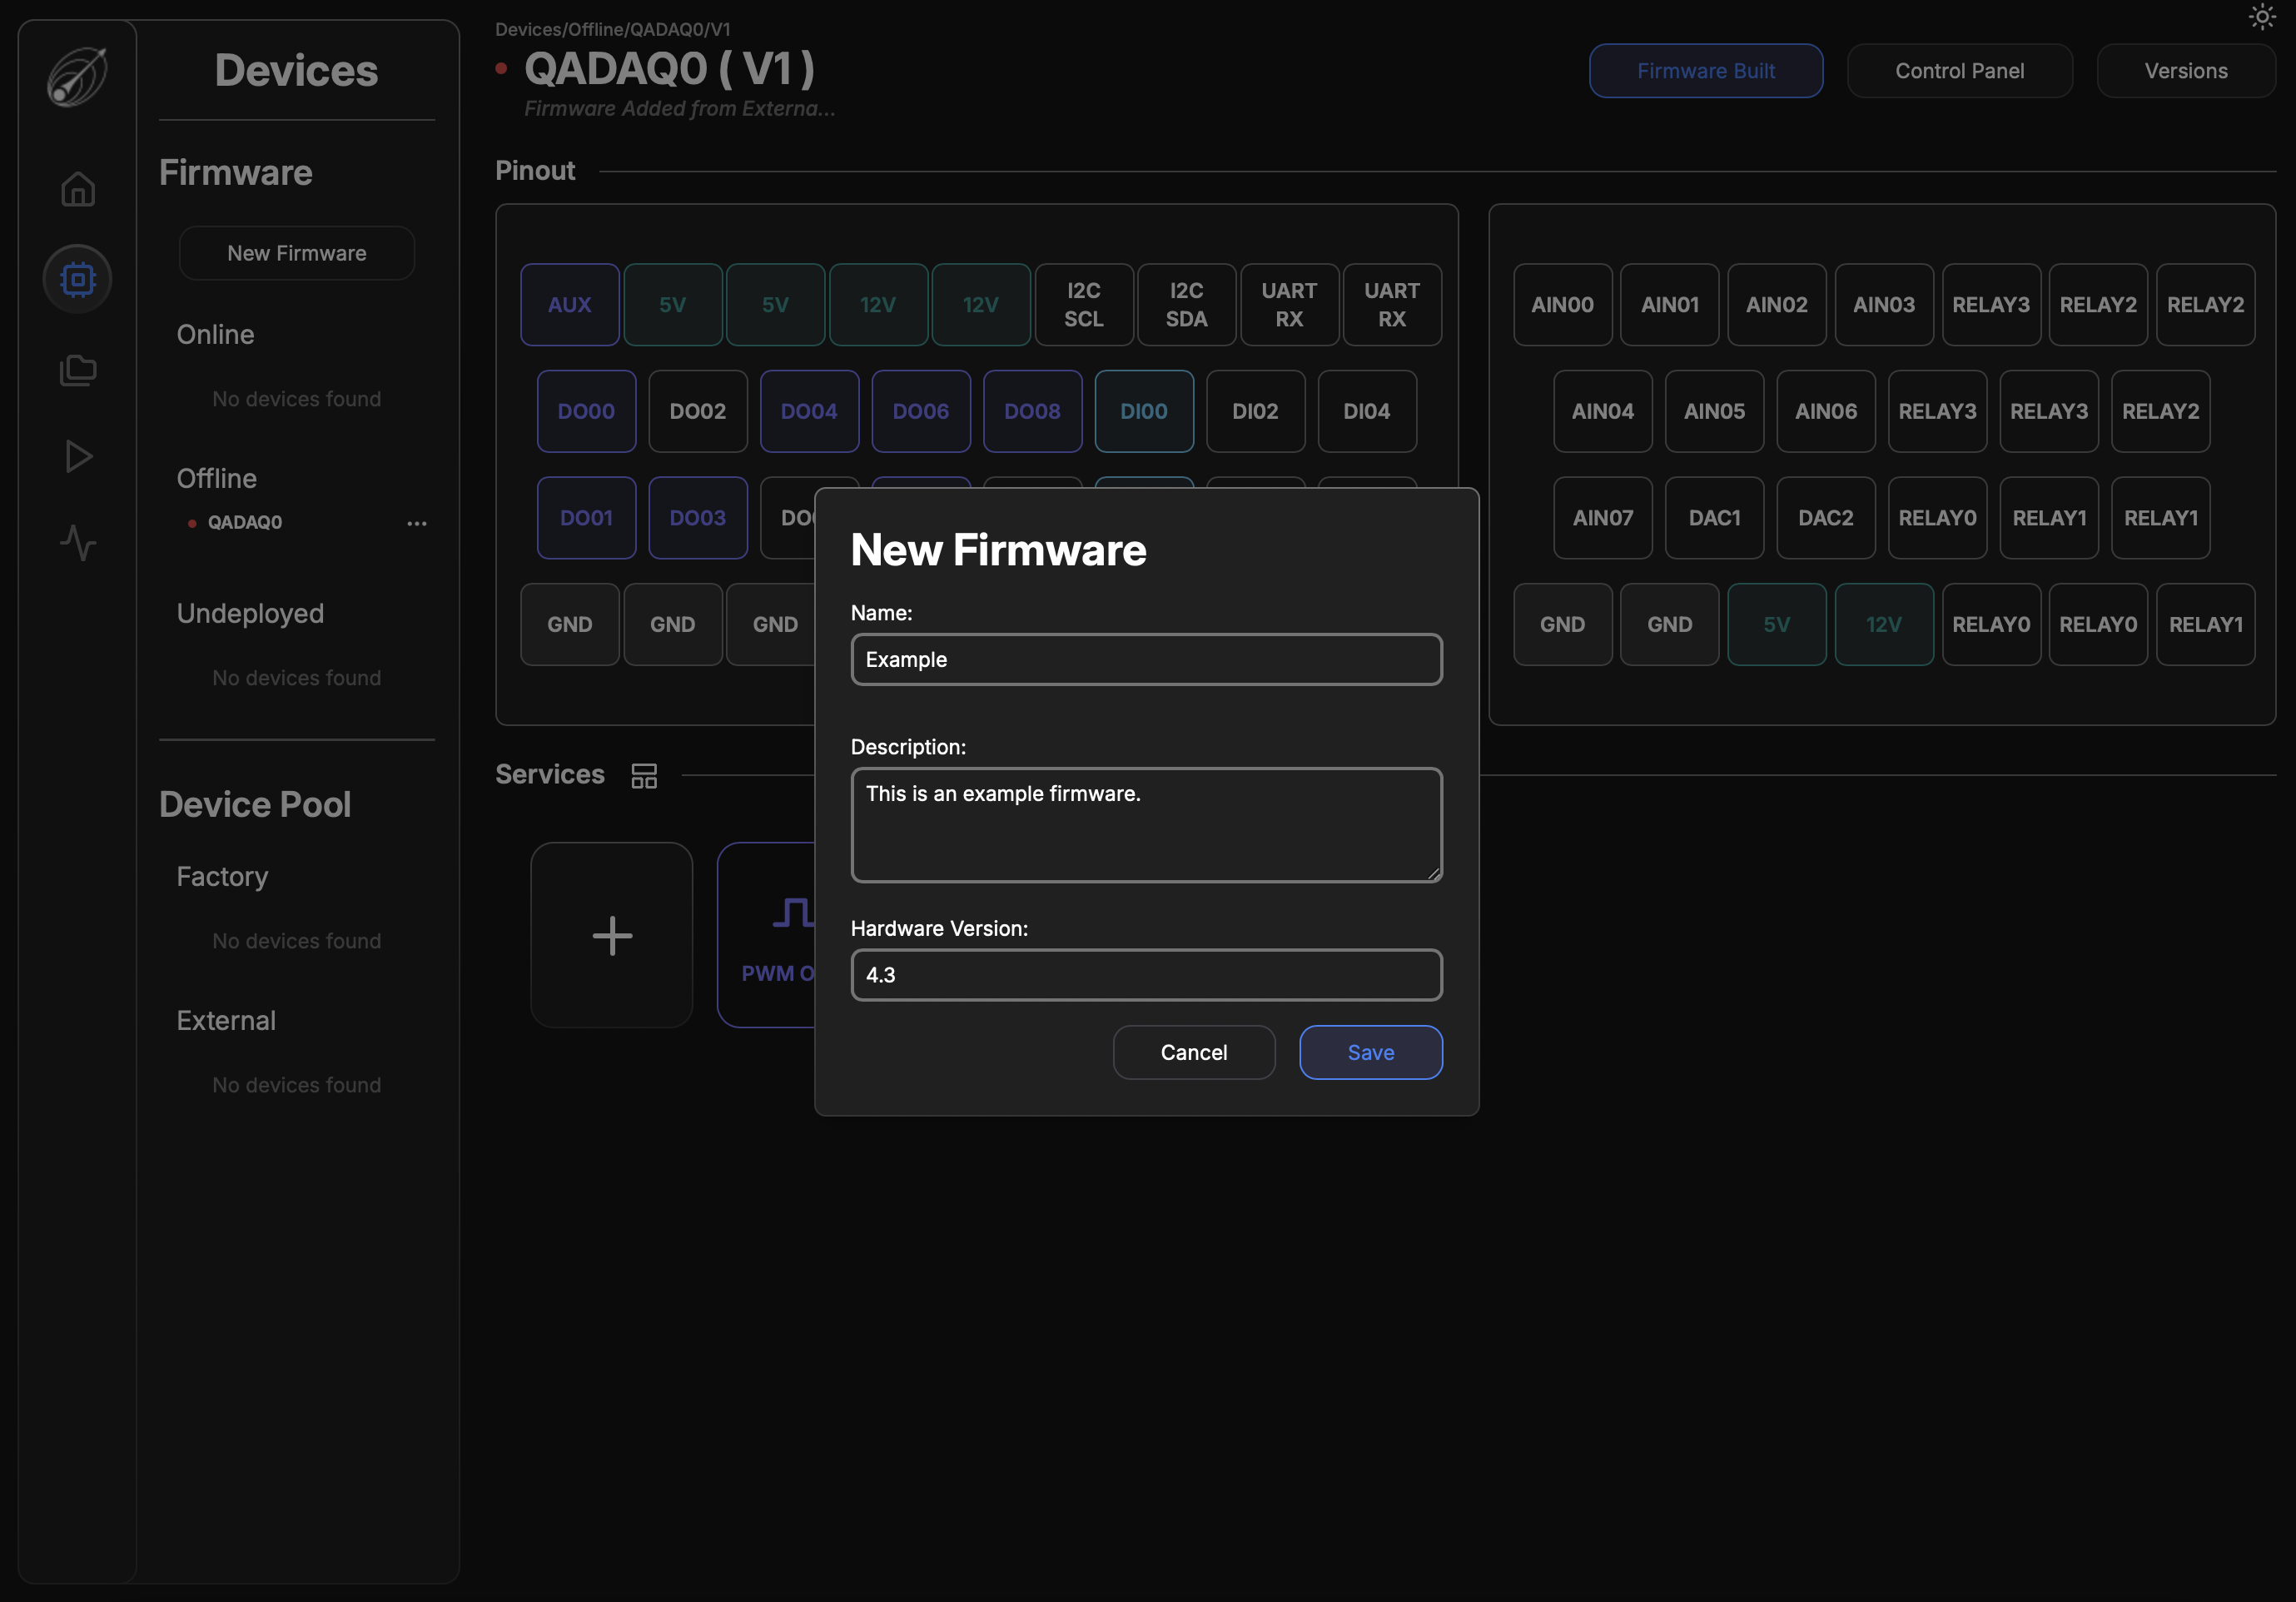
The Pinout section is populated by the combination of services defined in a given firmware. This display is a representation of looking into the main I/O connector of a DAQAstra and will inform the user on how the DAQAstra must be wired to interface with the configured sensors and/or actuators.
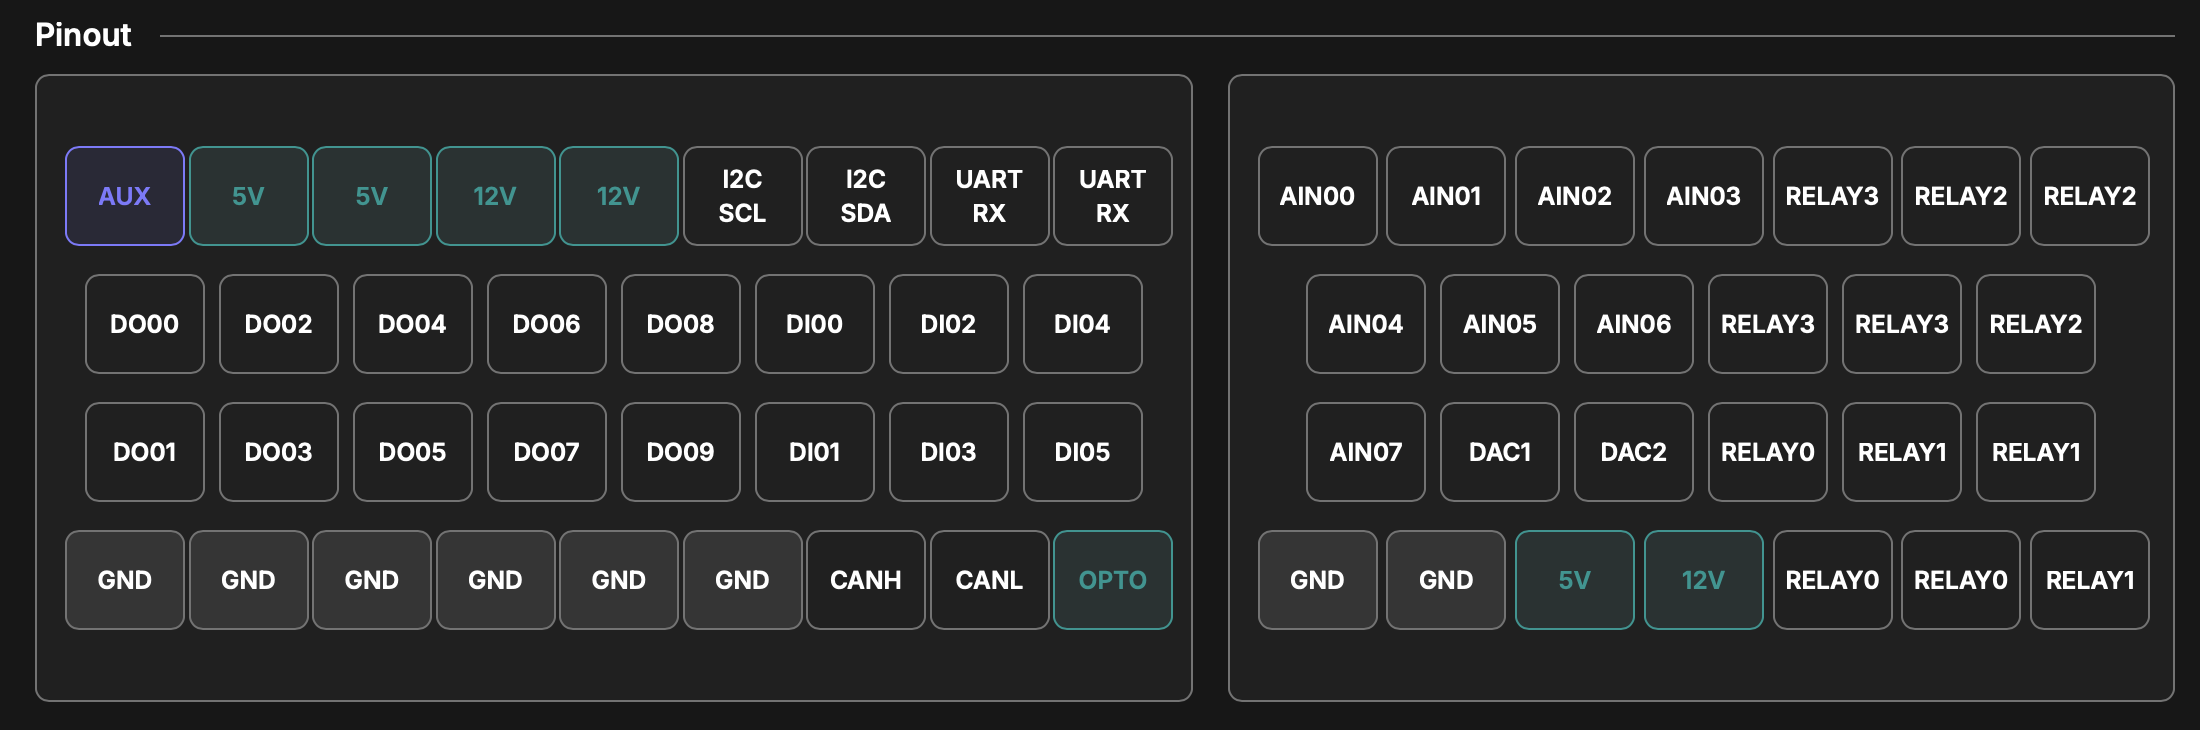
In this case, there are no services defined yet, so the pinout is empty.
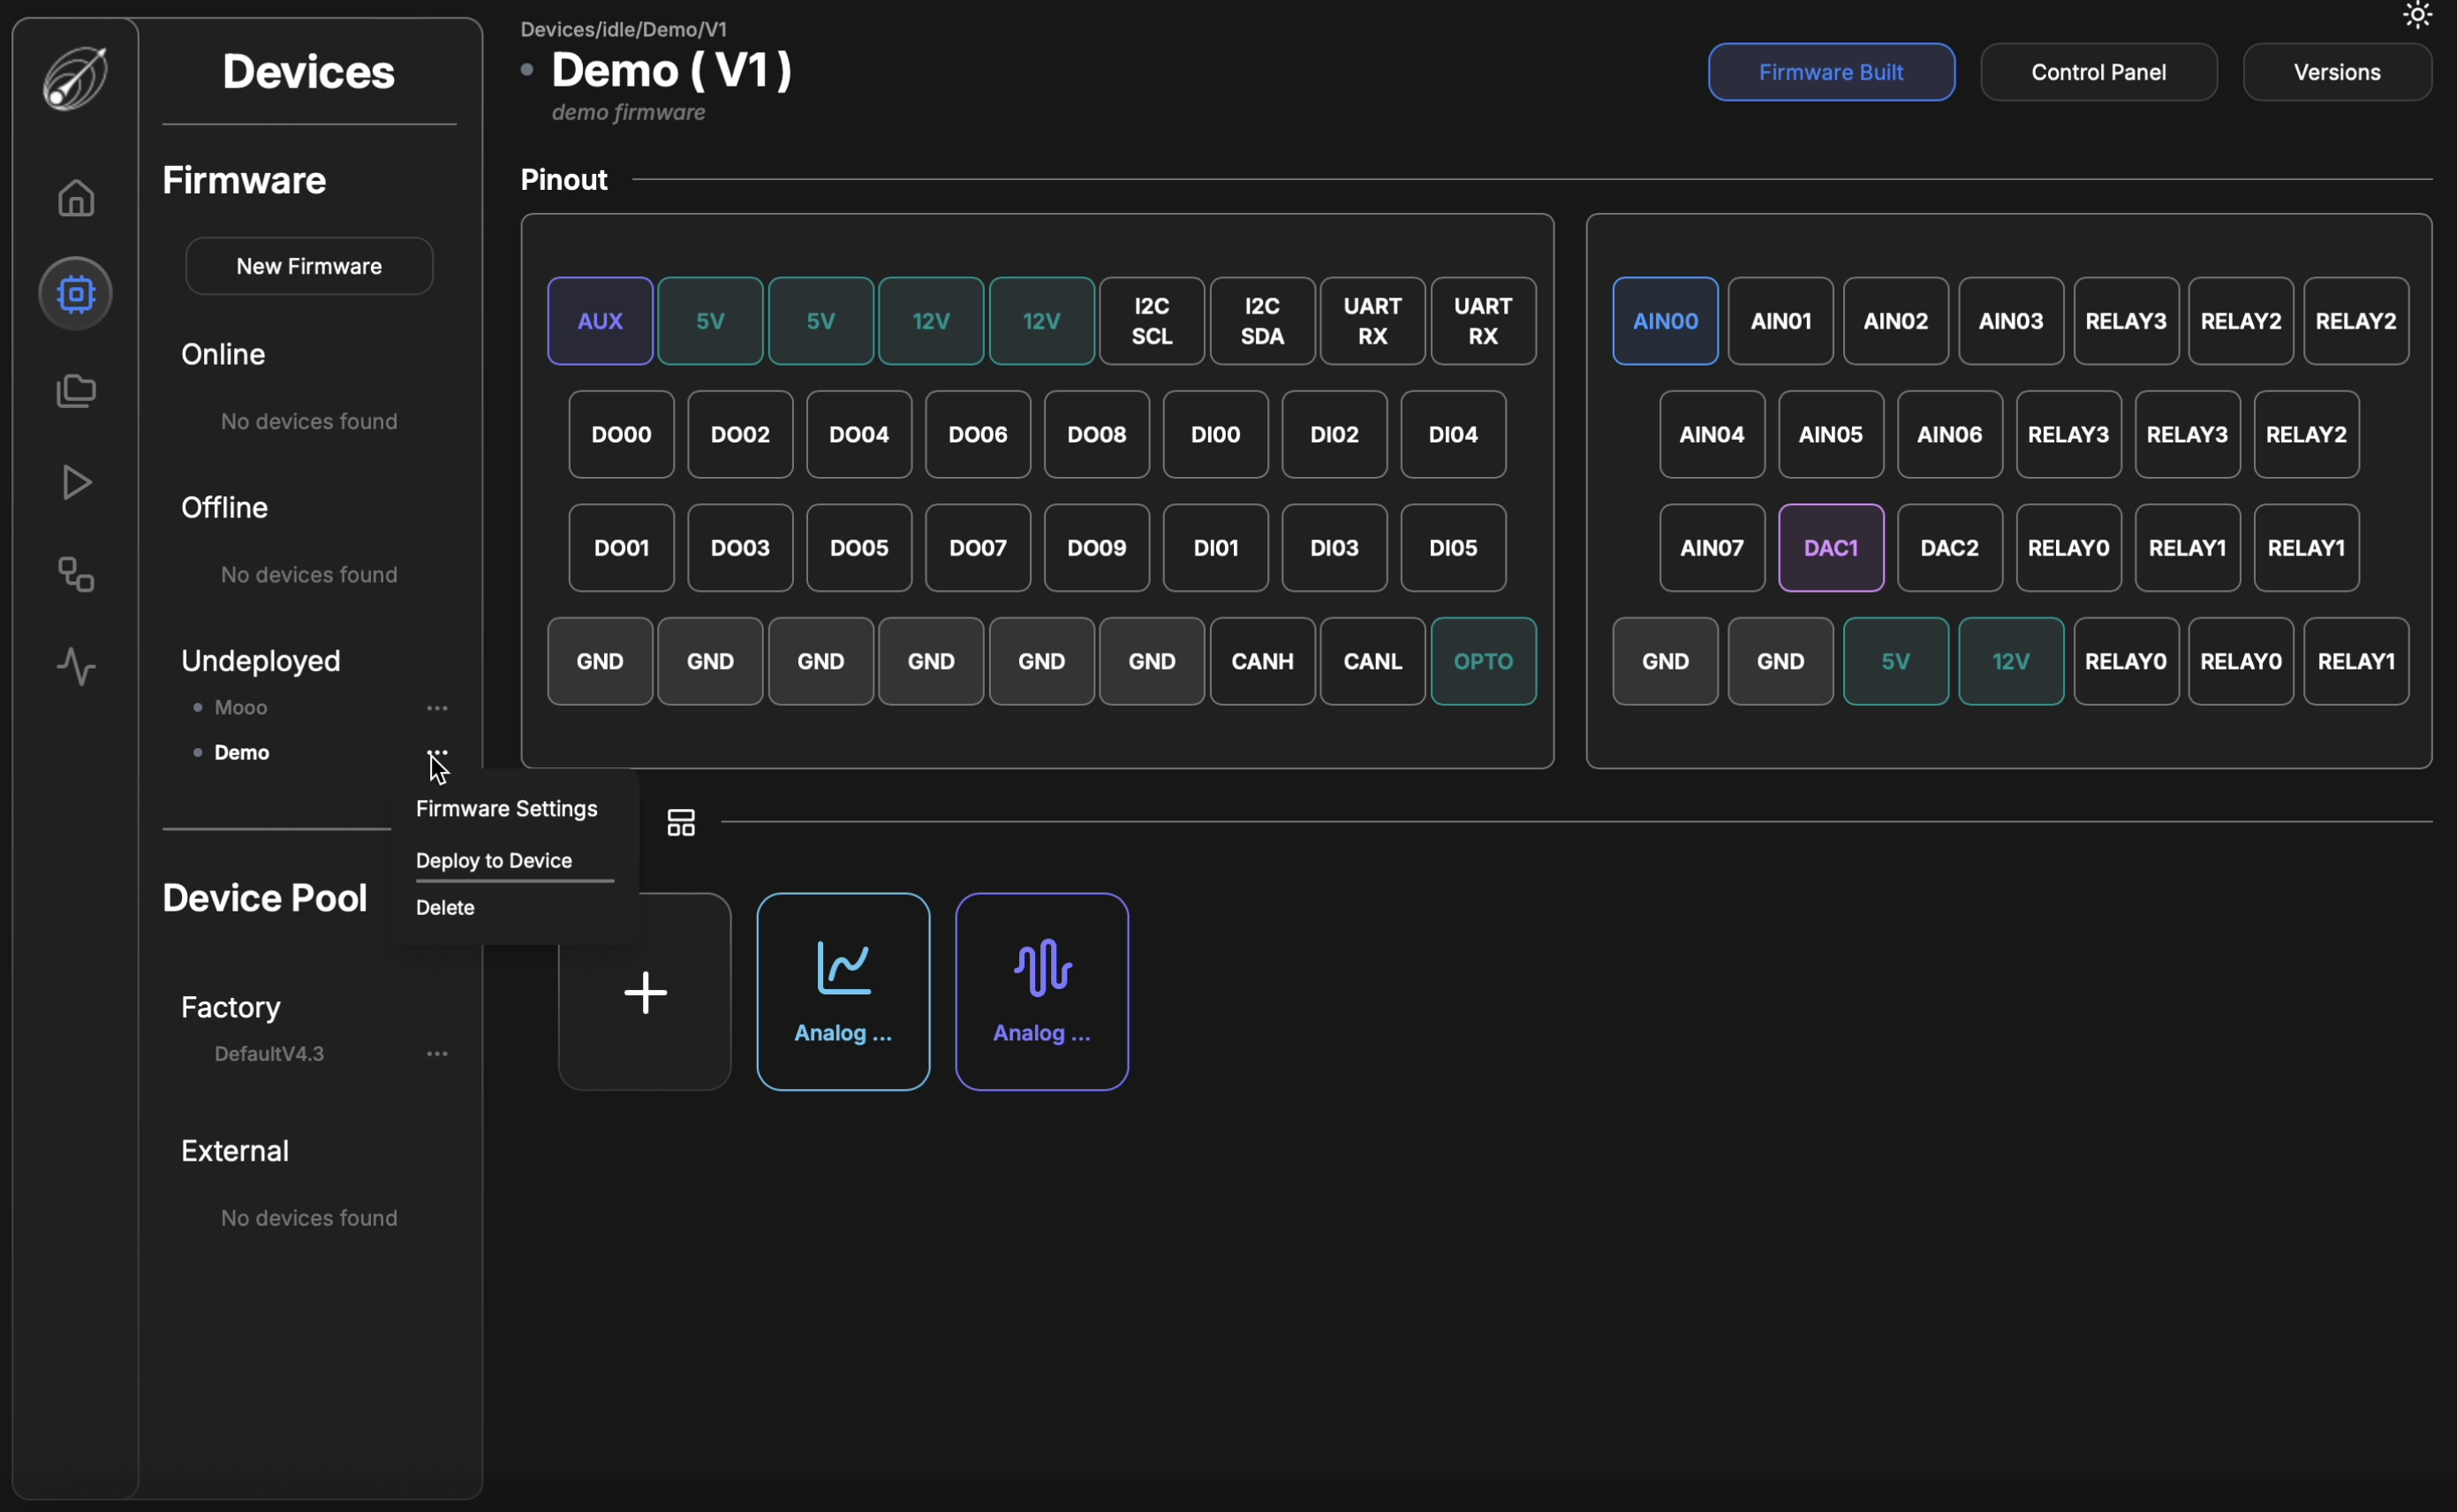
An undeployed firmware is specifically a firmware that does not have an associated DAQAstra, thus the right-click menu options differ from that shown on the previous page.
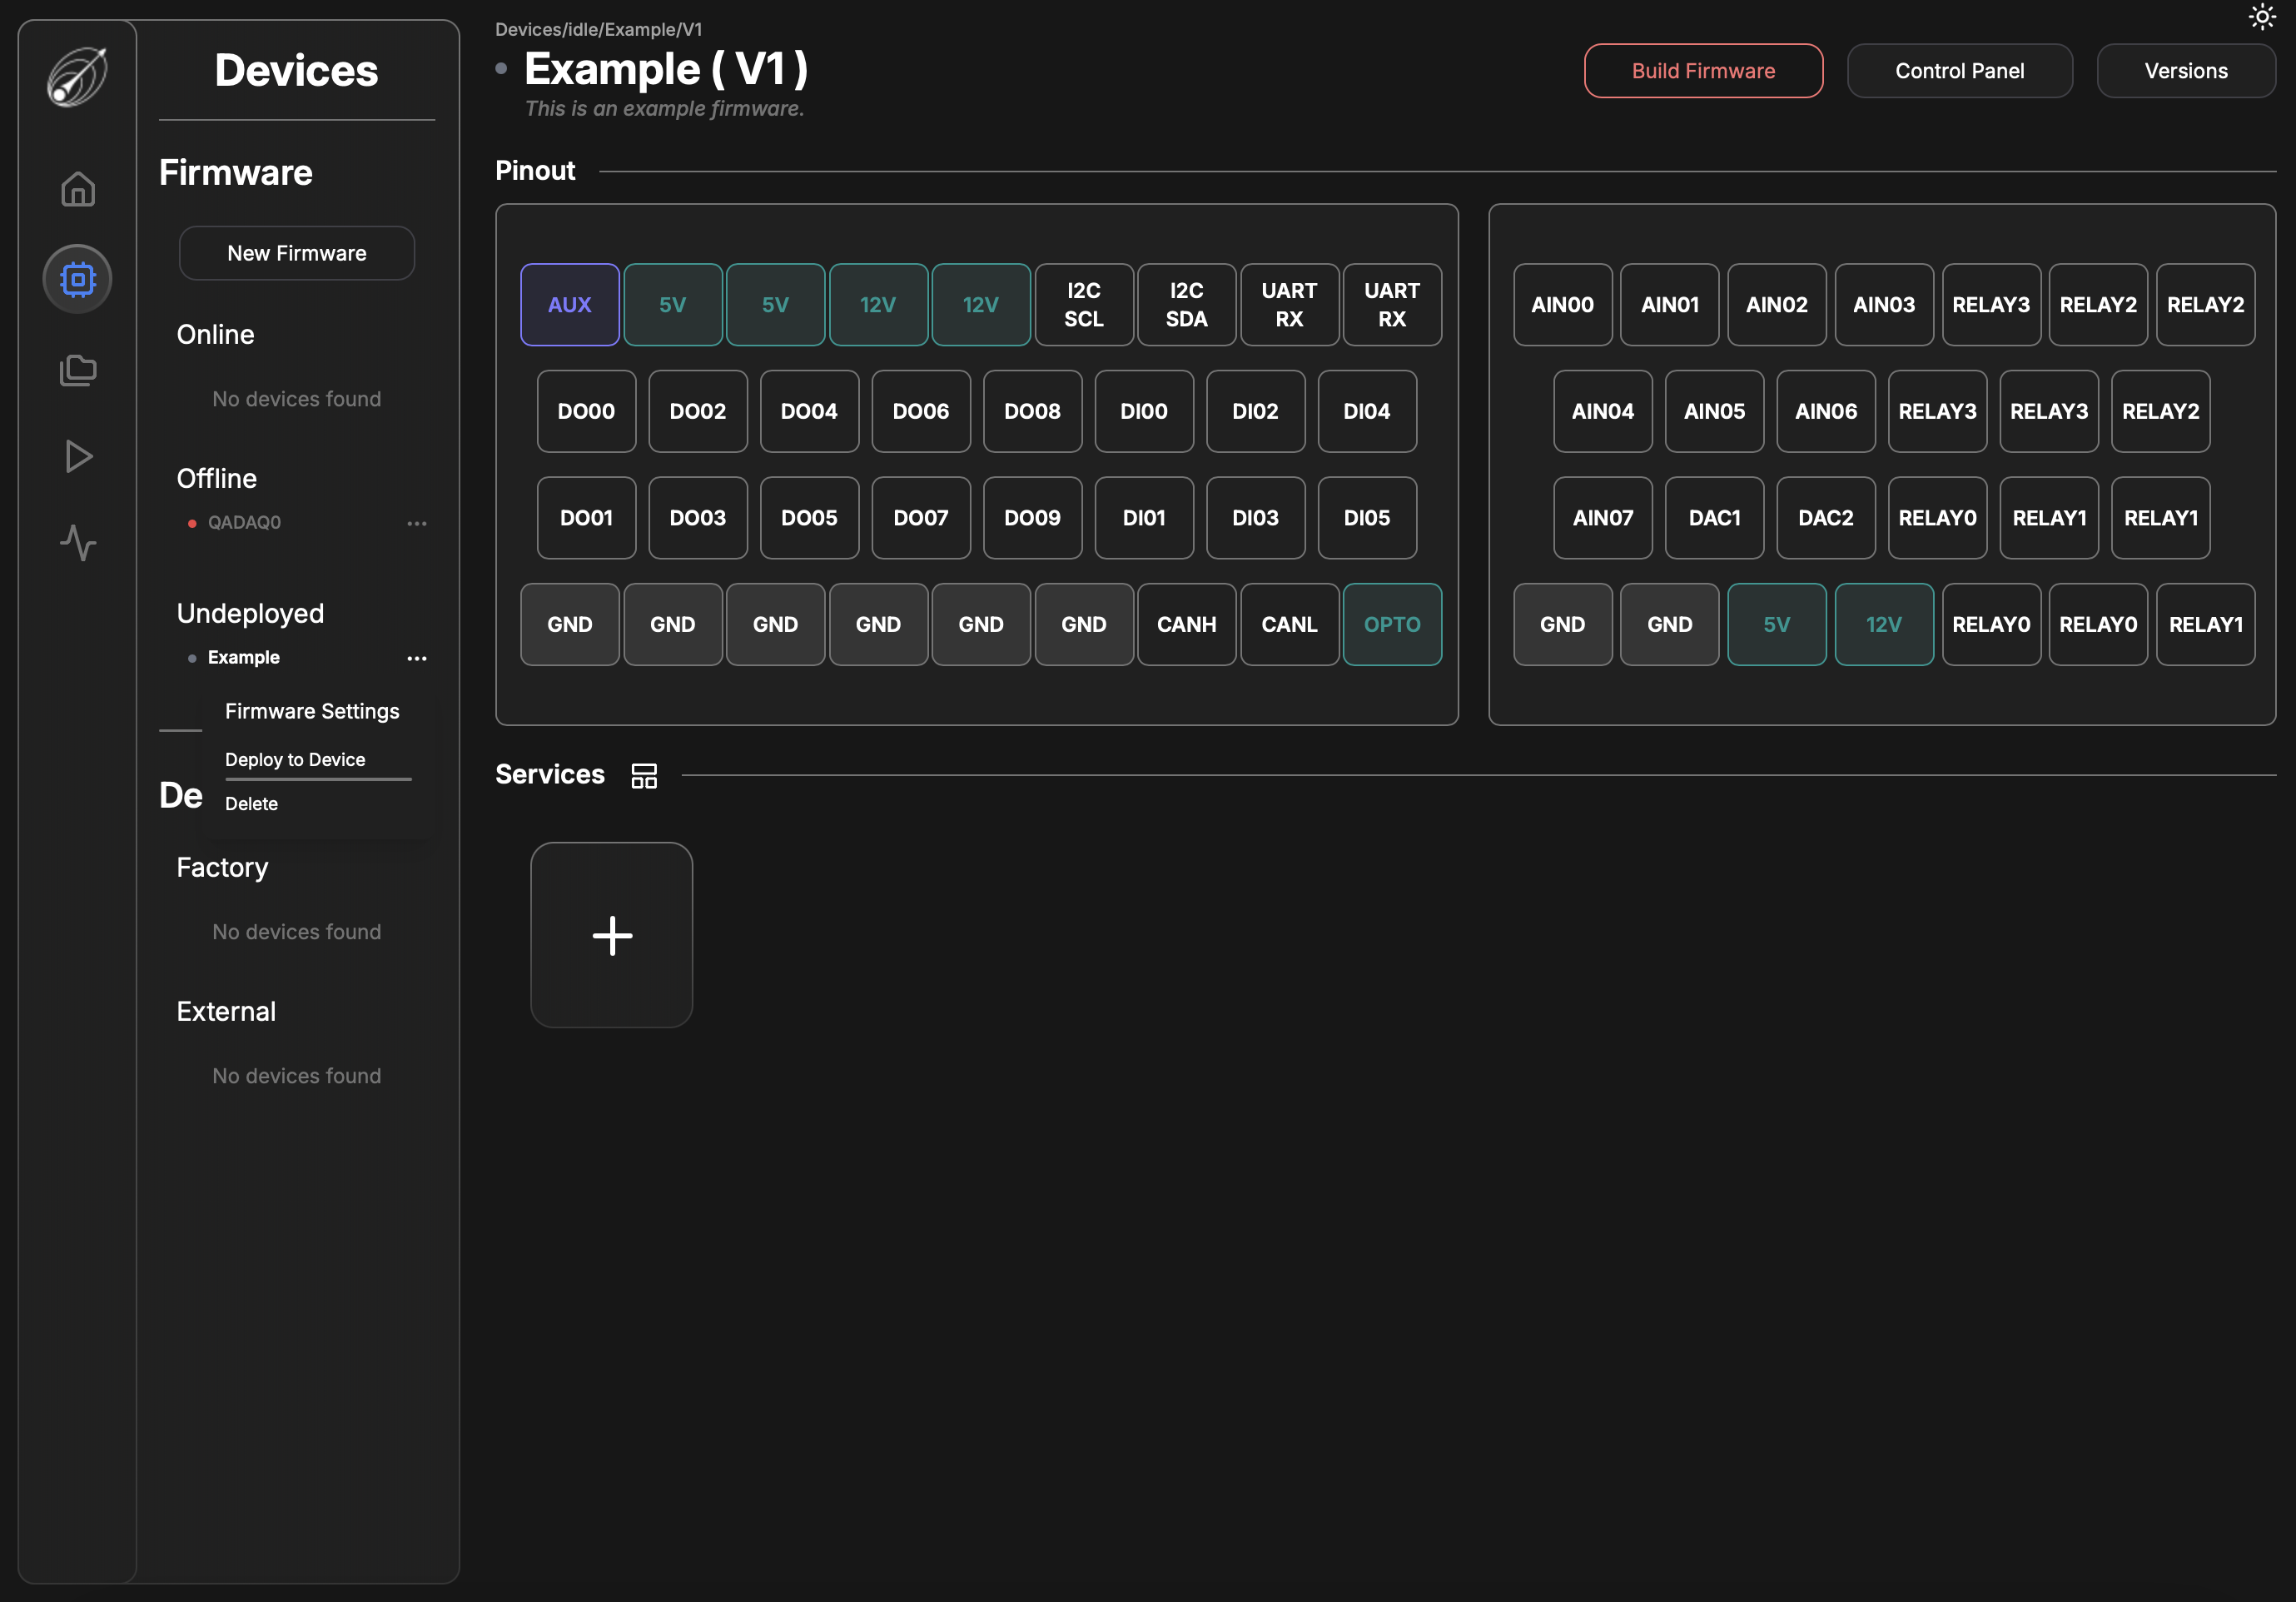
Deploy to Device allows the user to select an available Factory (default) DAQAstra in the Device Pool to run the selected firmware on. The user cannot select an Online Device for this as all Online devices are already running other firmware.
Delete will delete the firmware and all of its versions from the database. This is only available when a firmware is undeployed.

The last part of this view that has not been addressed is the Services panel, which is covered in the next section.
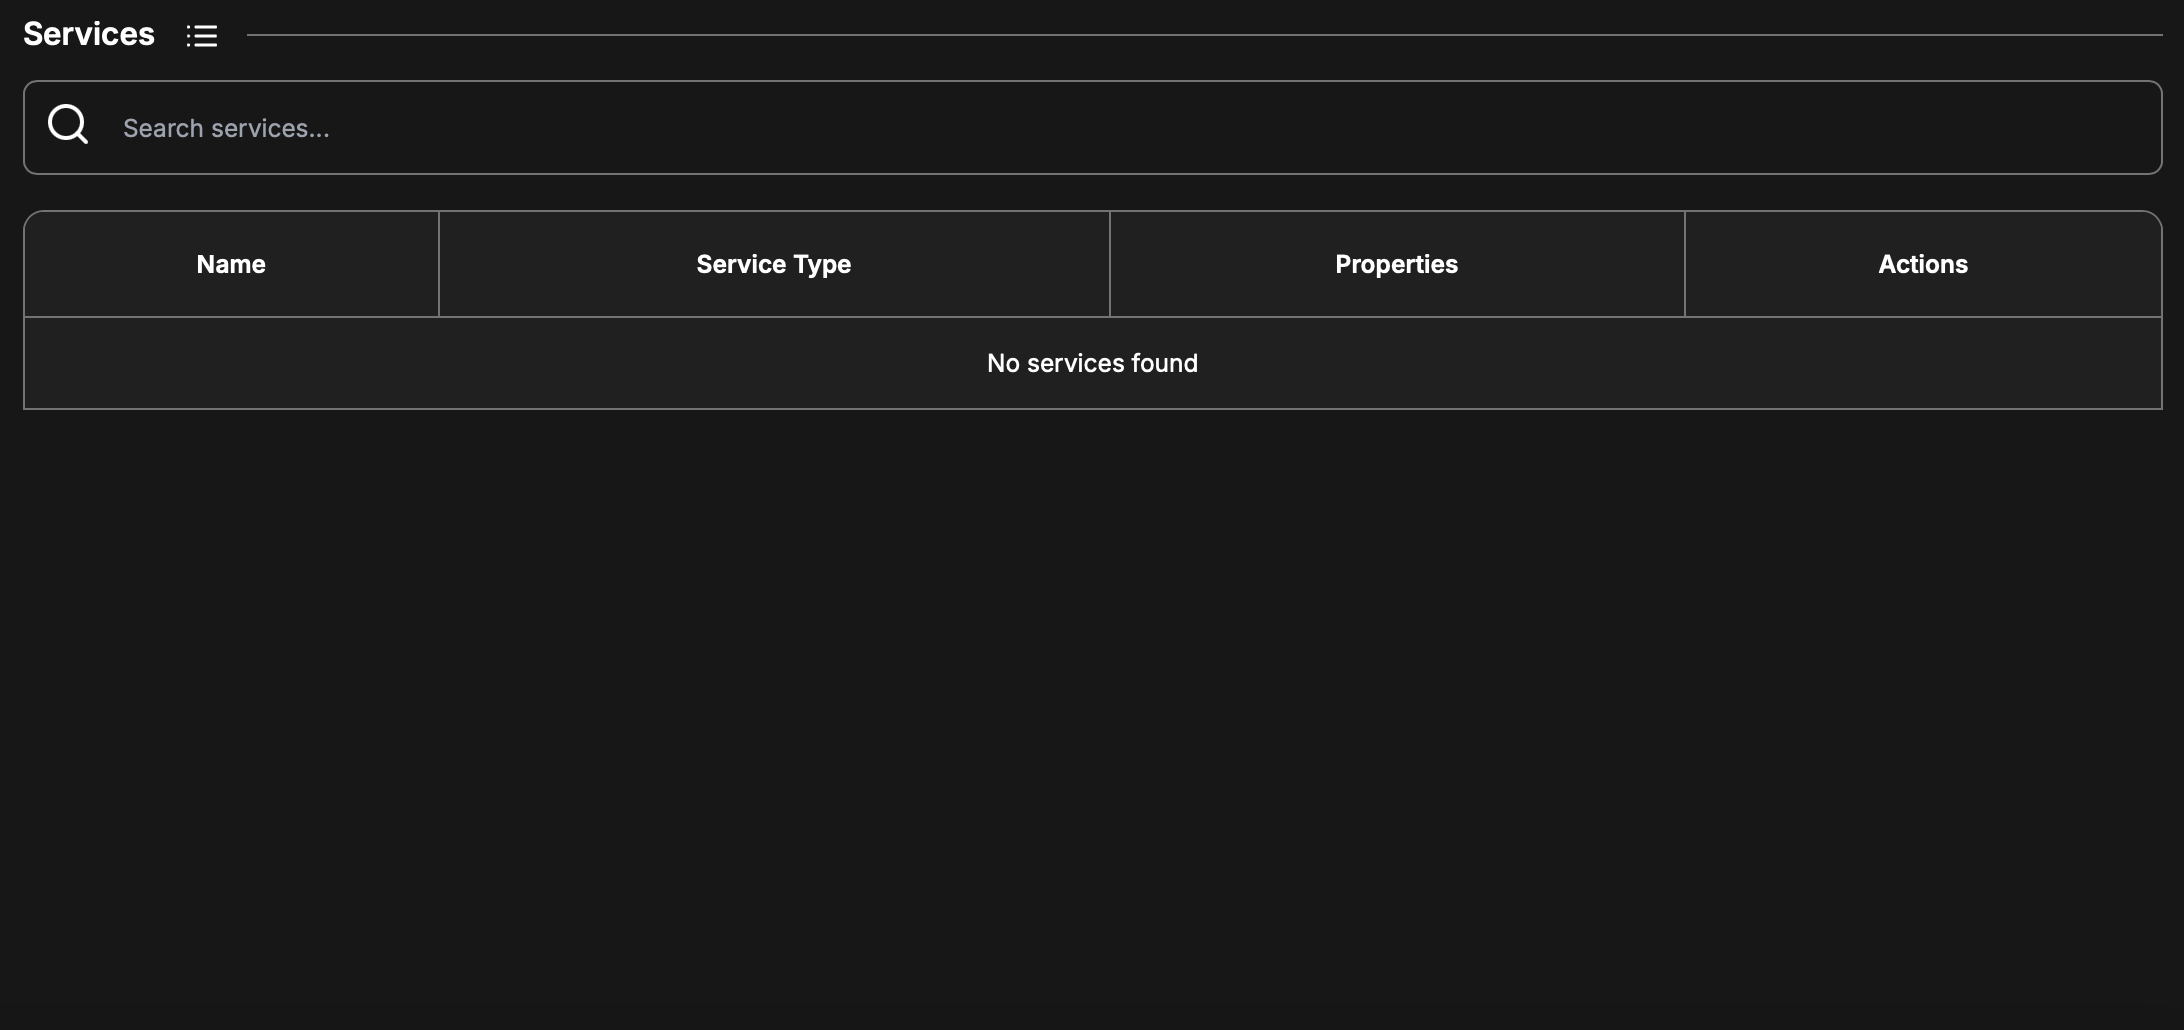
Service Interface
There are two primary views for the Service list, there is a compact view (tabular) and a icon view. This is toggled by clicking the button adjacent to the Services label on the interface.
Icon view
![]()
Compact view
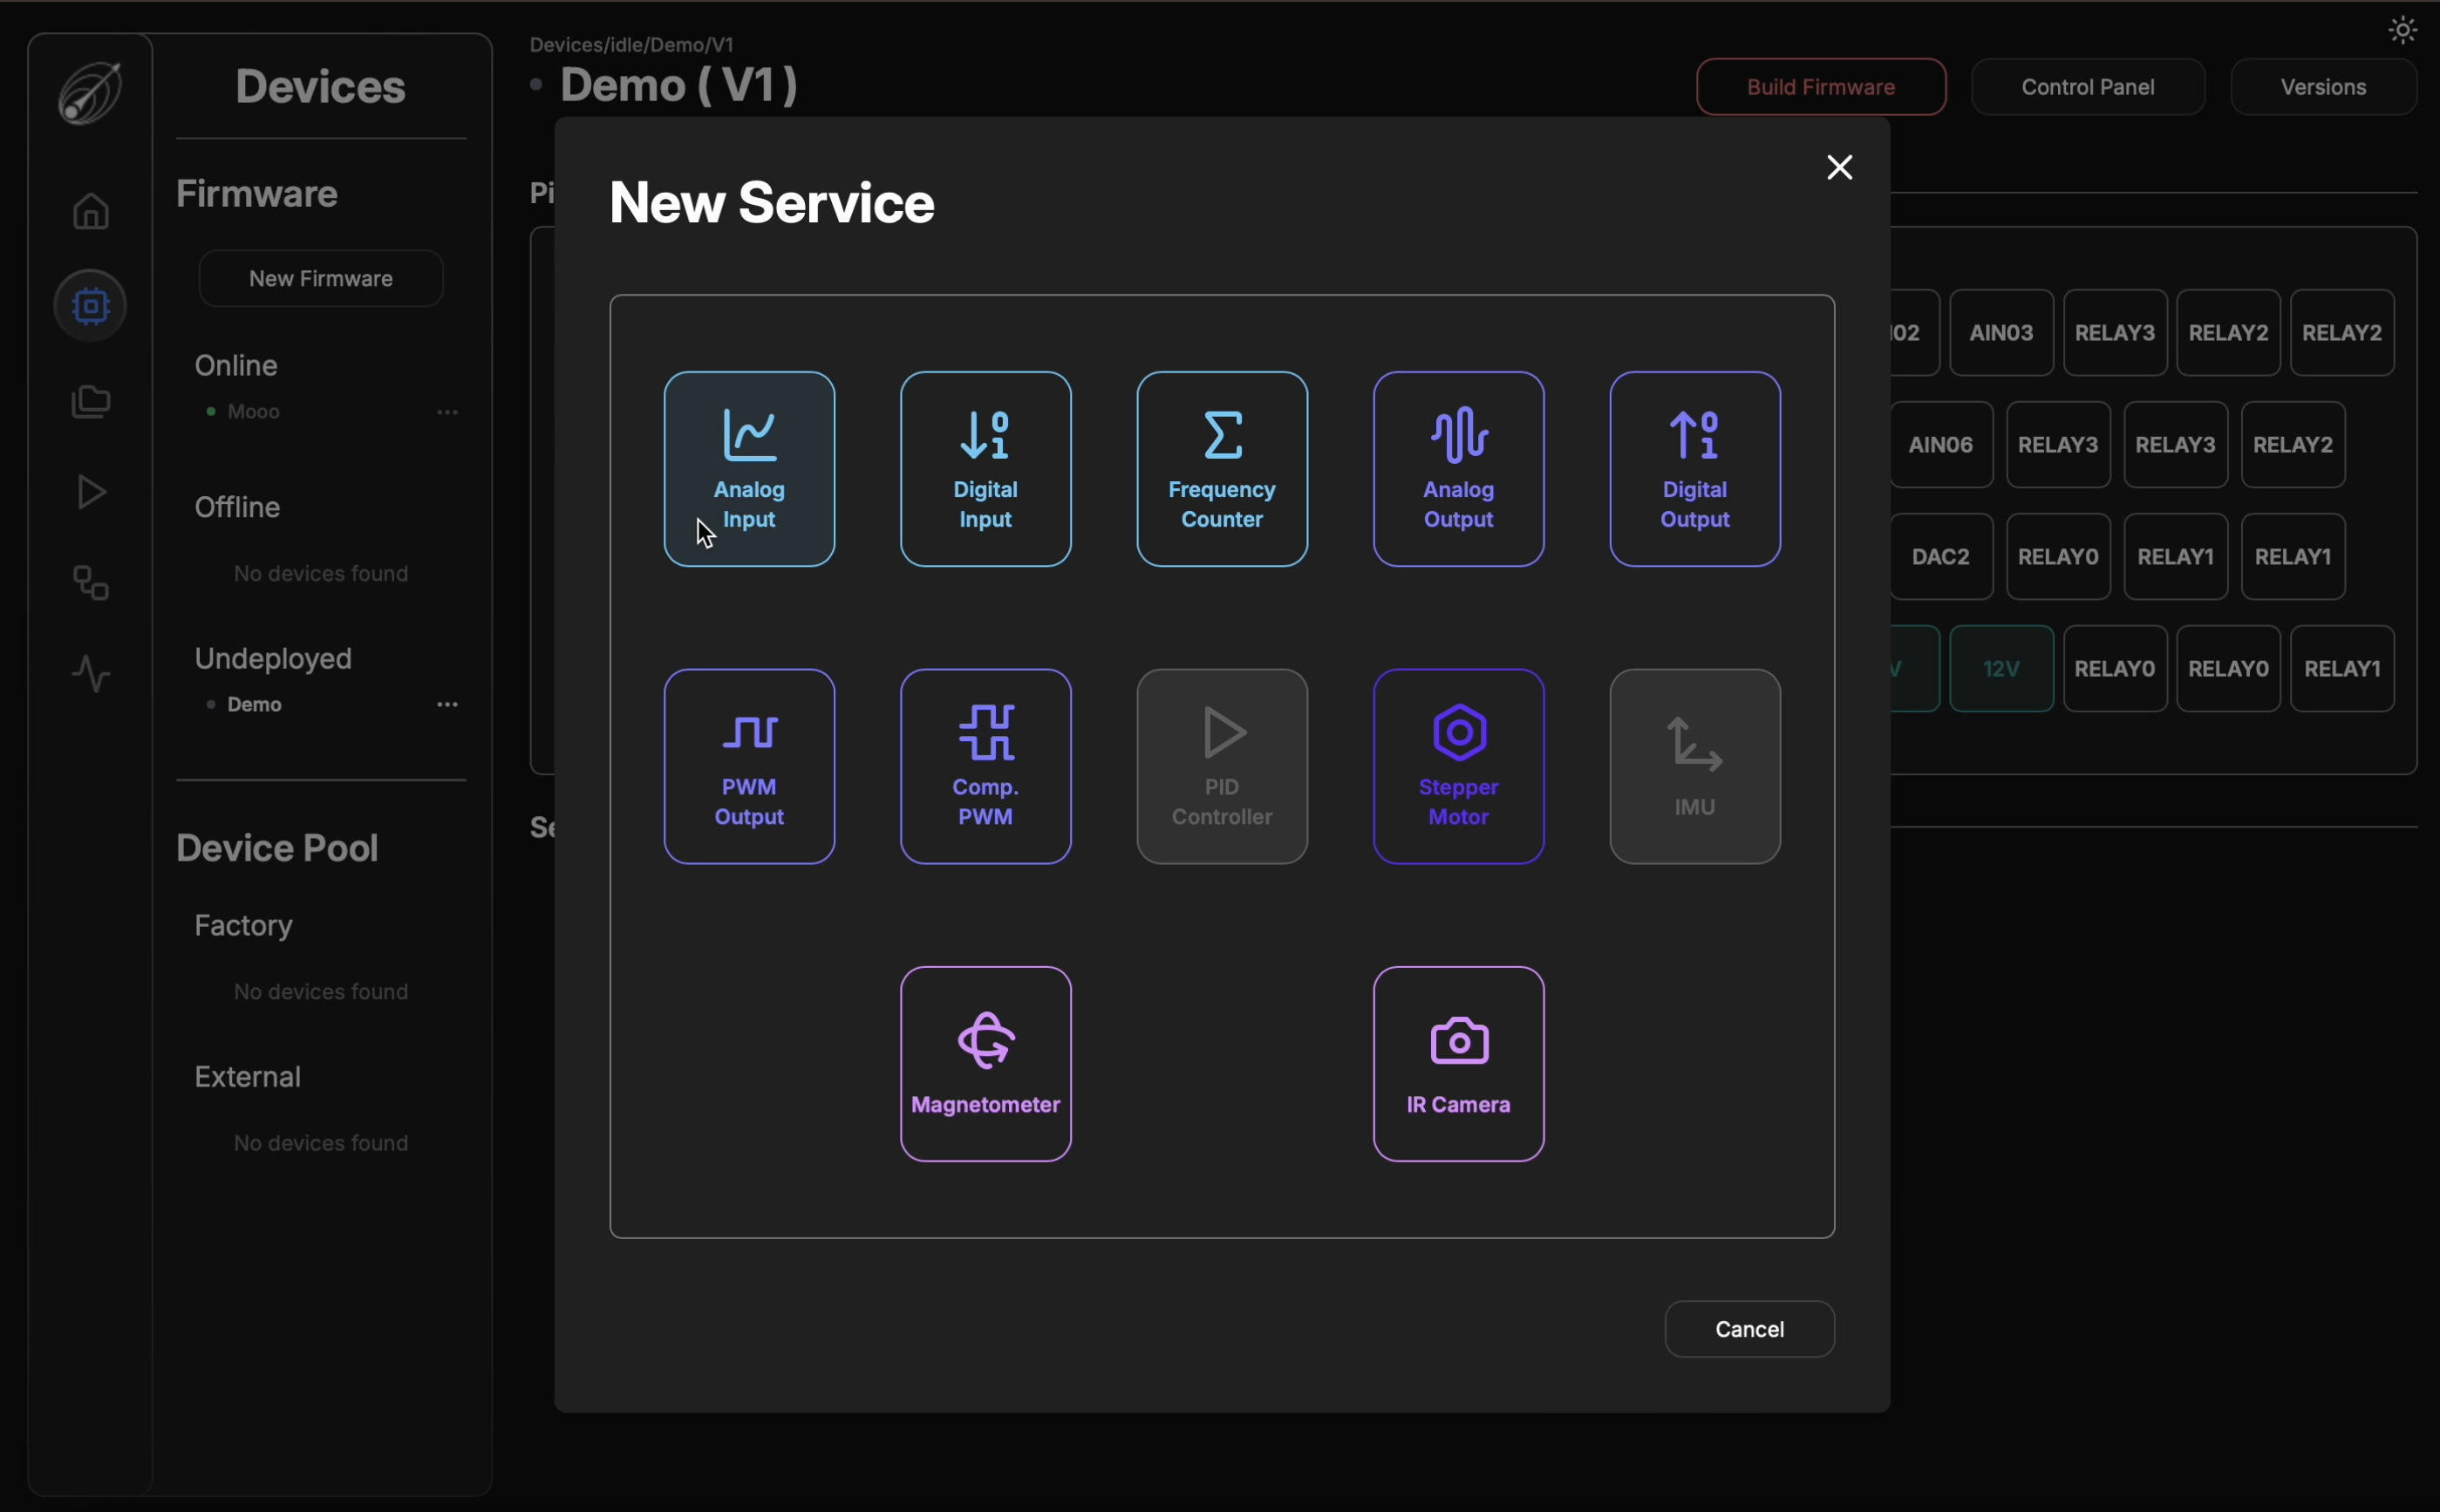
A new firmware has no services defined, so lets add a new service definition. Clicking on the + icon button, the following panel is opened.
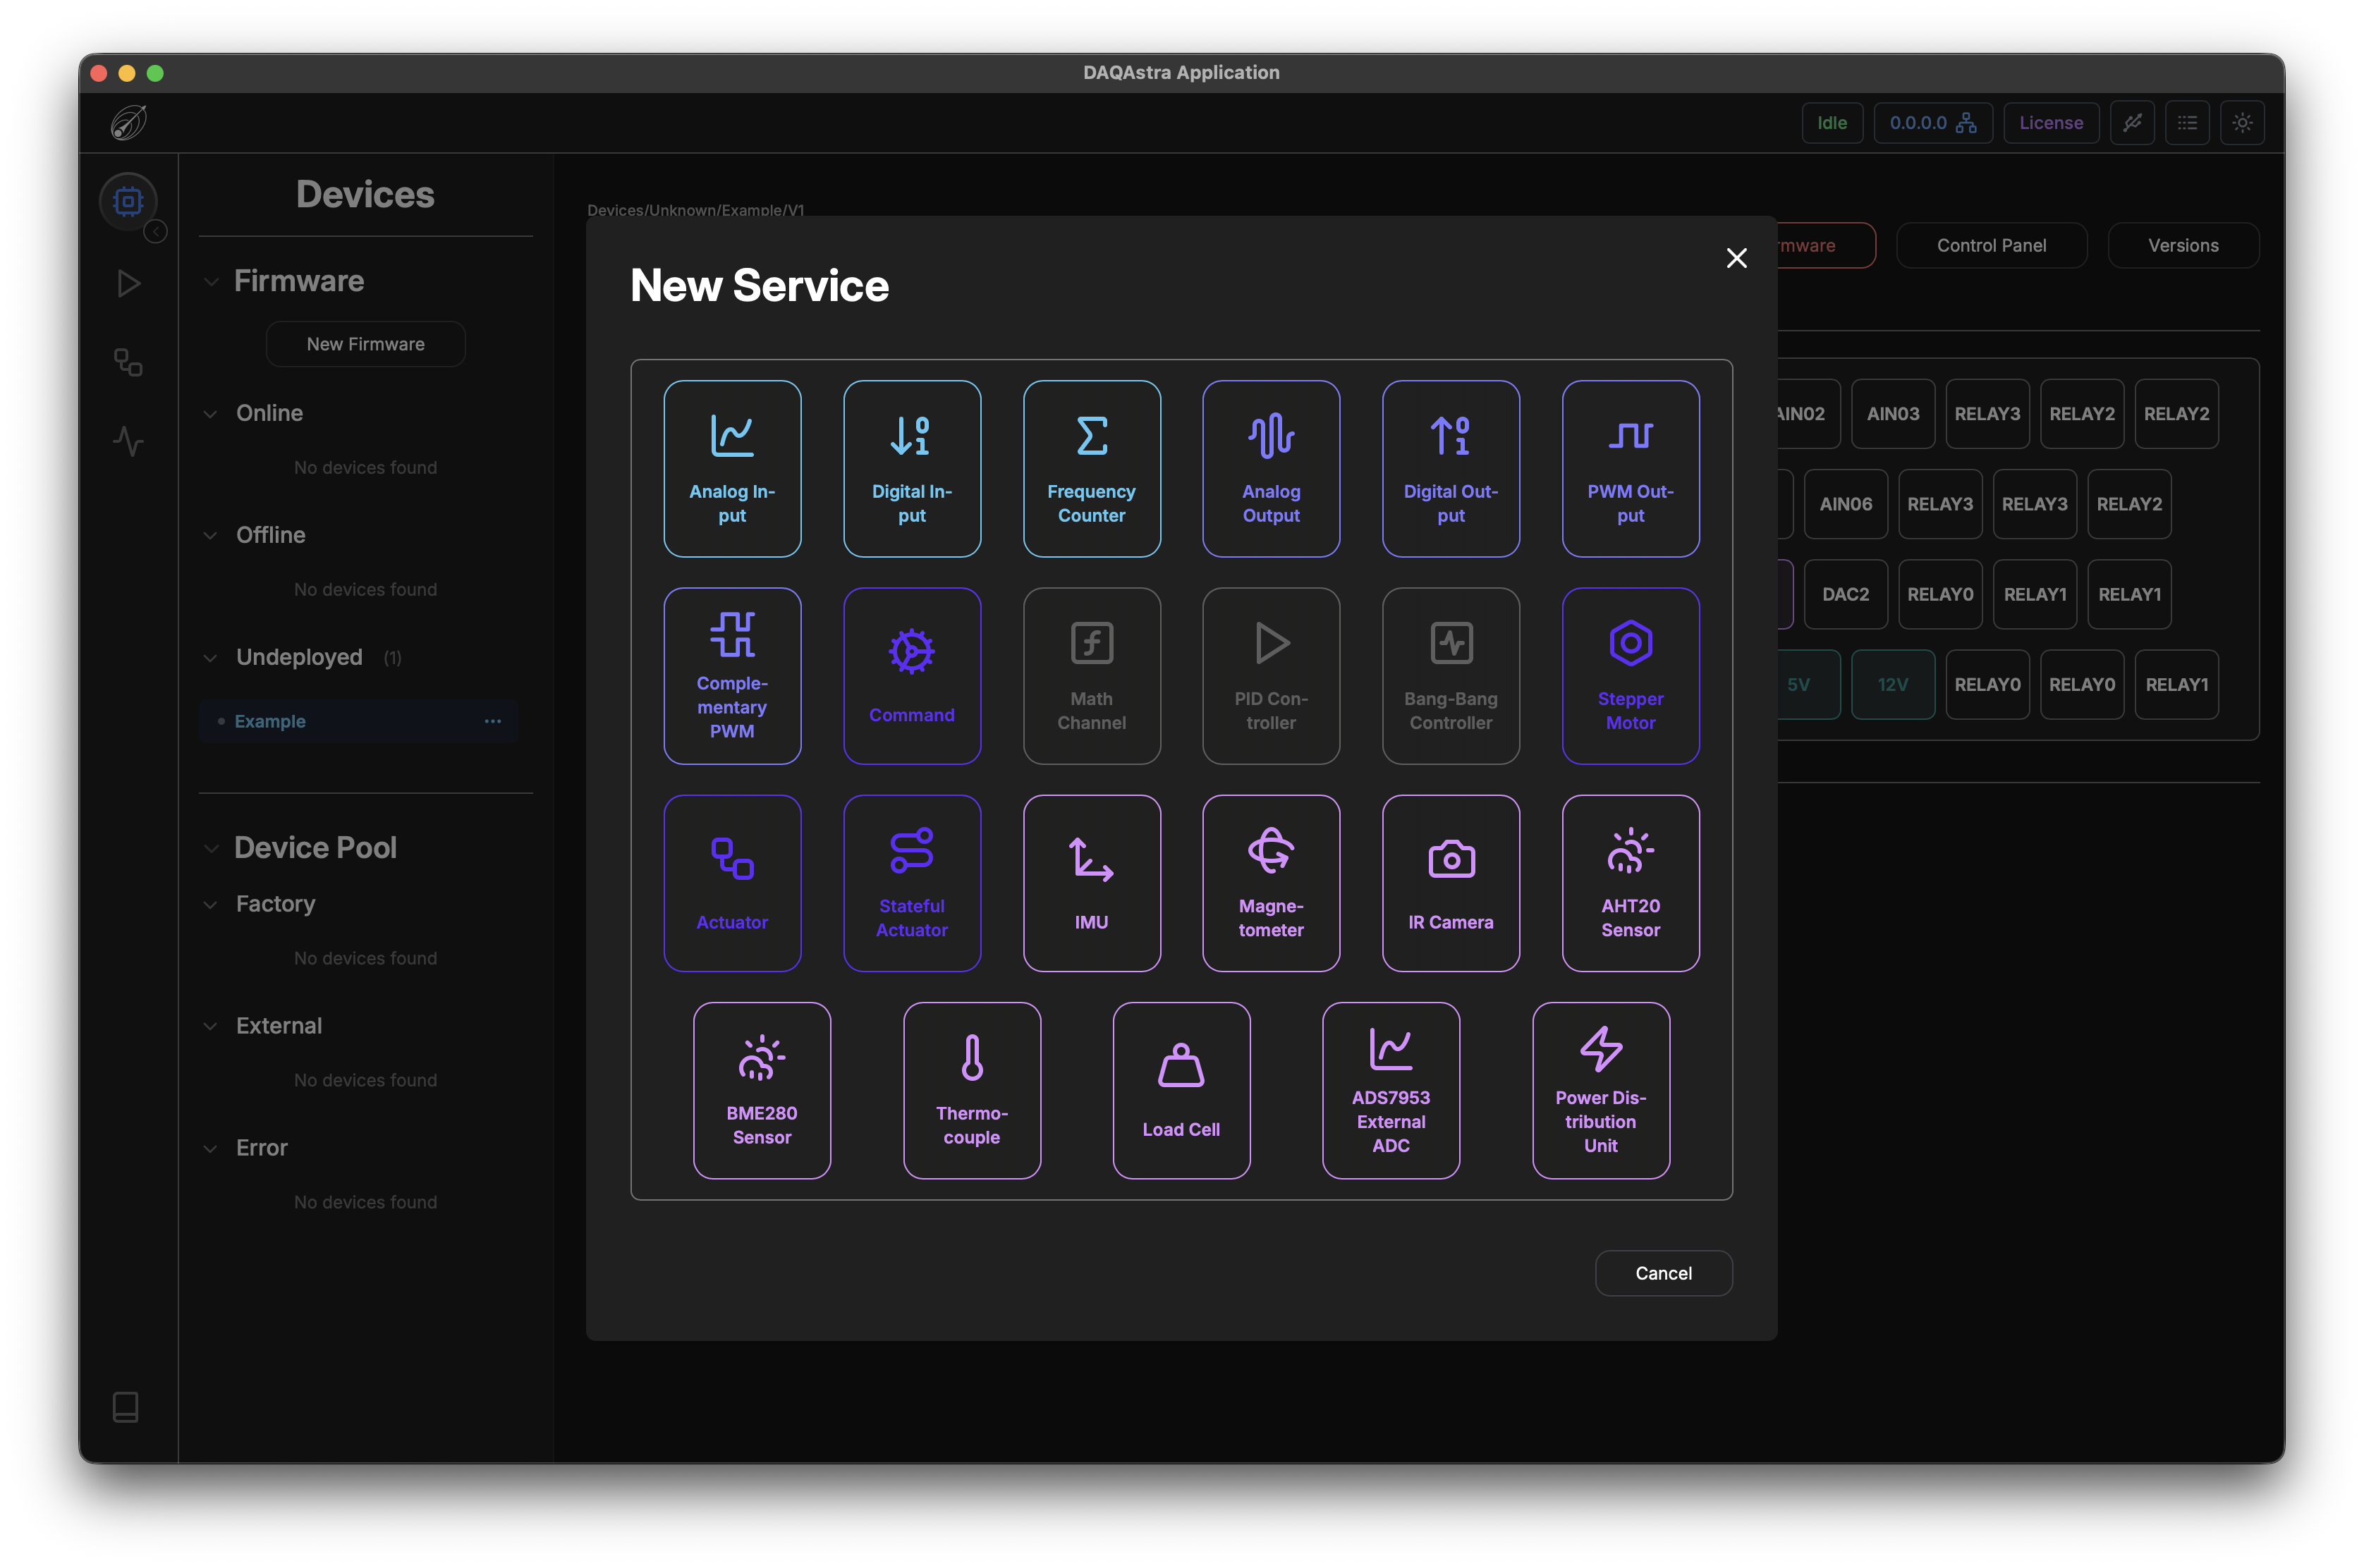
Each of the services listed here are defined in detail in the Service Types section. As an example, though, we will just create a Digital Output service.
Filling out the form and clicking Save will add this service to the list and light up the pin(s) that are used in that service.
![]()
The Actions available in the compact view can also be access in the icon view via right-click.
-
Edit: The user can modify configuration fields of the existing service. -
Duplicate: The user can copy all of the non-unique fields of the configuration and clone them. They will just have to specify a new name and an unused pin. -
Remove: This will delete the service from the firmware.
Service Types
Configuration Forms
A
Firmwareas defined in the previous section is a collection of services which will be run on a DAQAstra. Each service and associated configuration fields are defined in this section.
Table of Contents
- Analog Input
- Digital Input
- Frequency Counter
- Analog Output
- Digital Output
- PWM Output
- Complementary PWM
- Command
- Math Channel
- PID Controller
- Bang-Bang Controller
- Stepper Motor
- Actuator
- Stateful Actuator
- IMU (MPU6050)
- Magnetometer (QMC5883L)
- IR Camera (MLX90640)
- Thermocouple (MAX31855)
- Load Cell (HX711)
- ADS7953
- Power-Distribution Unit
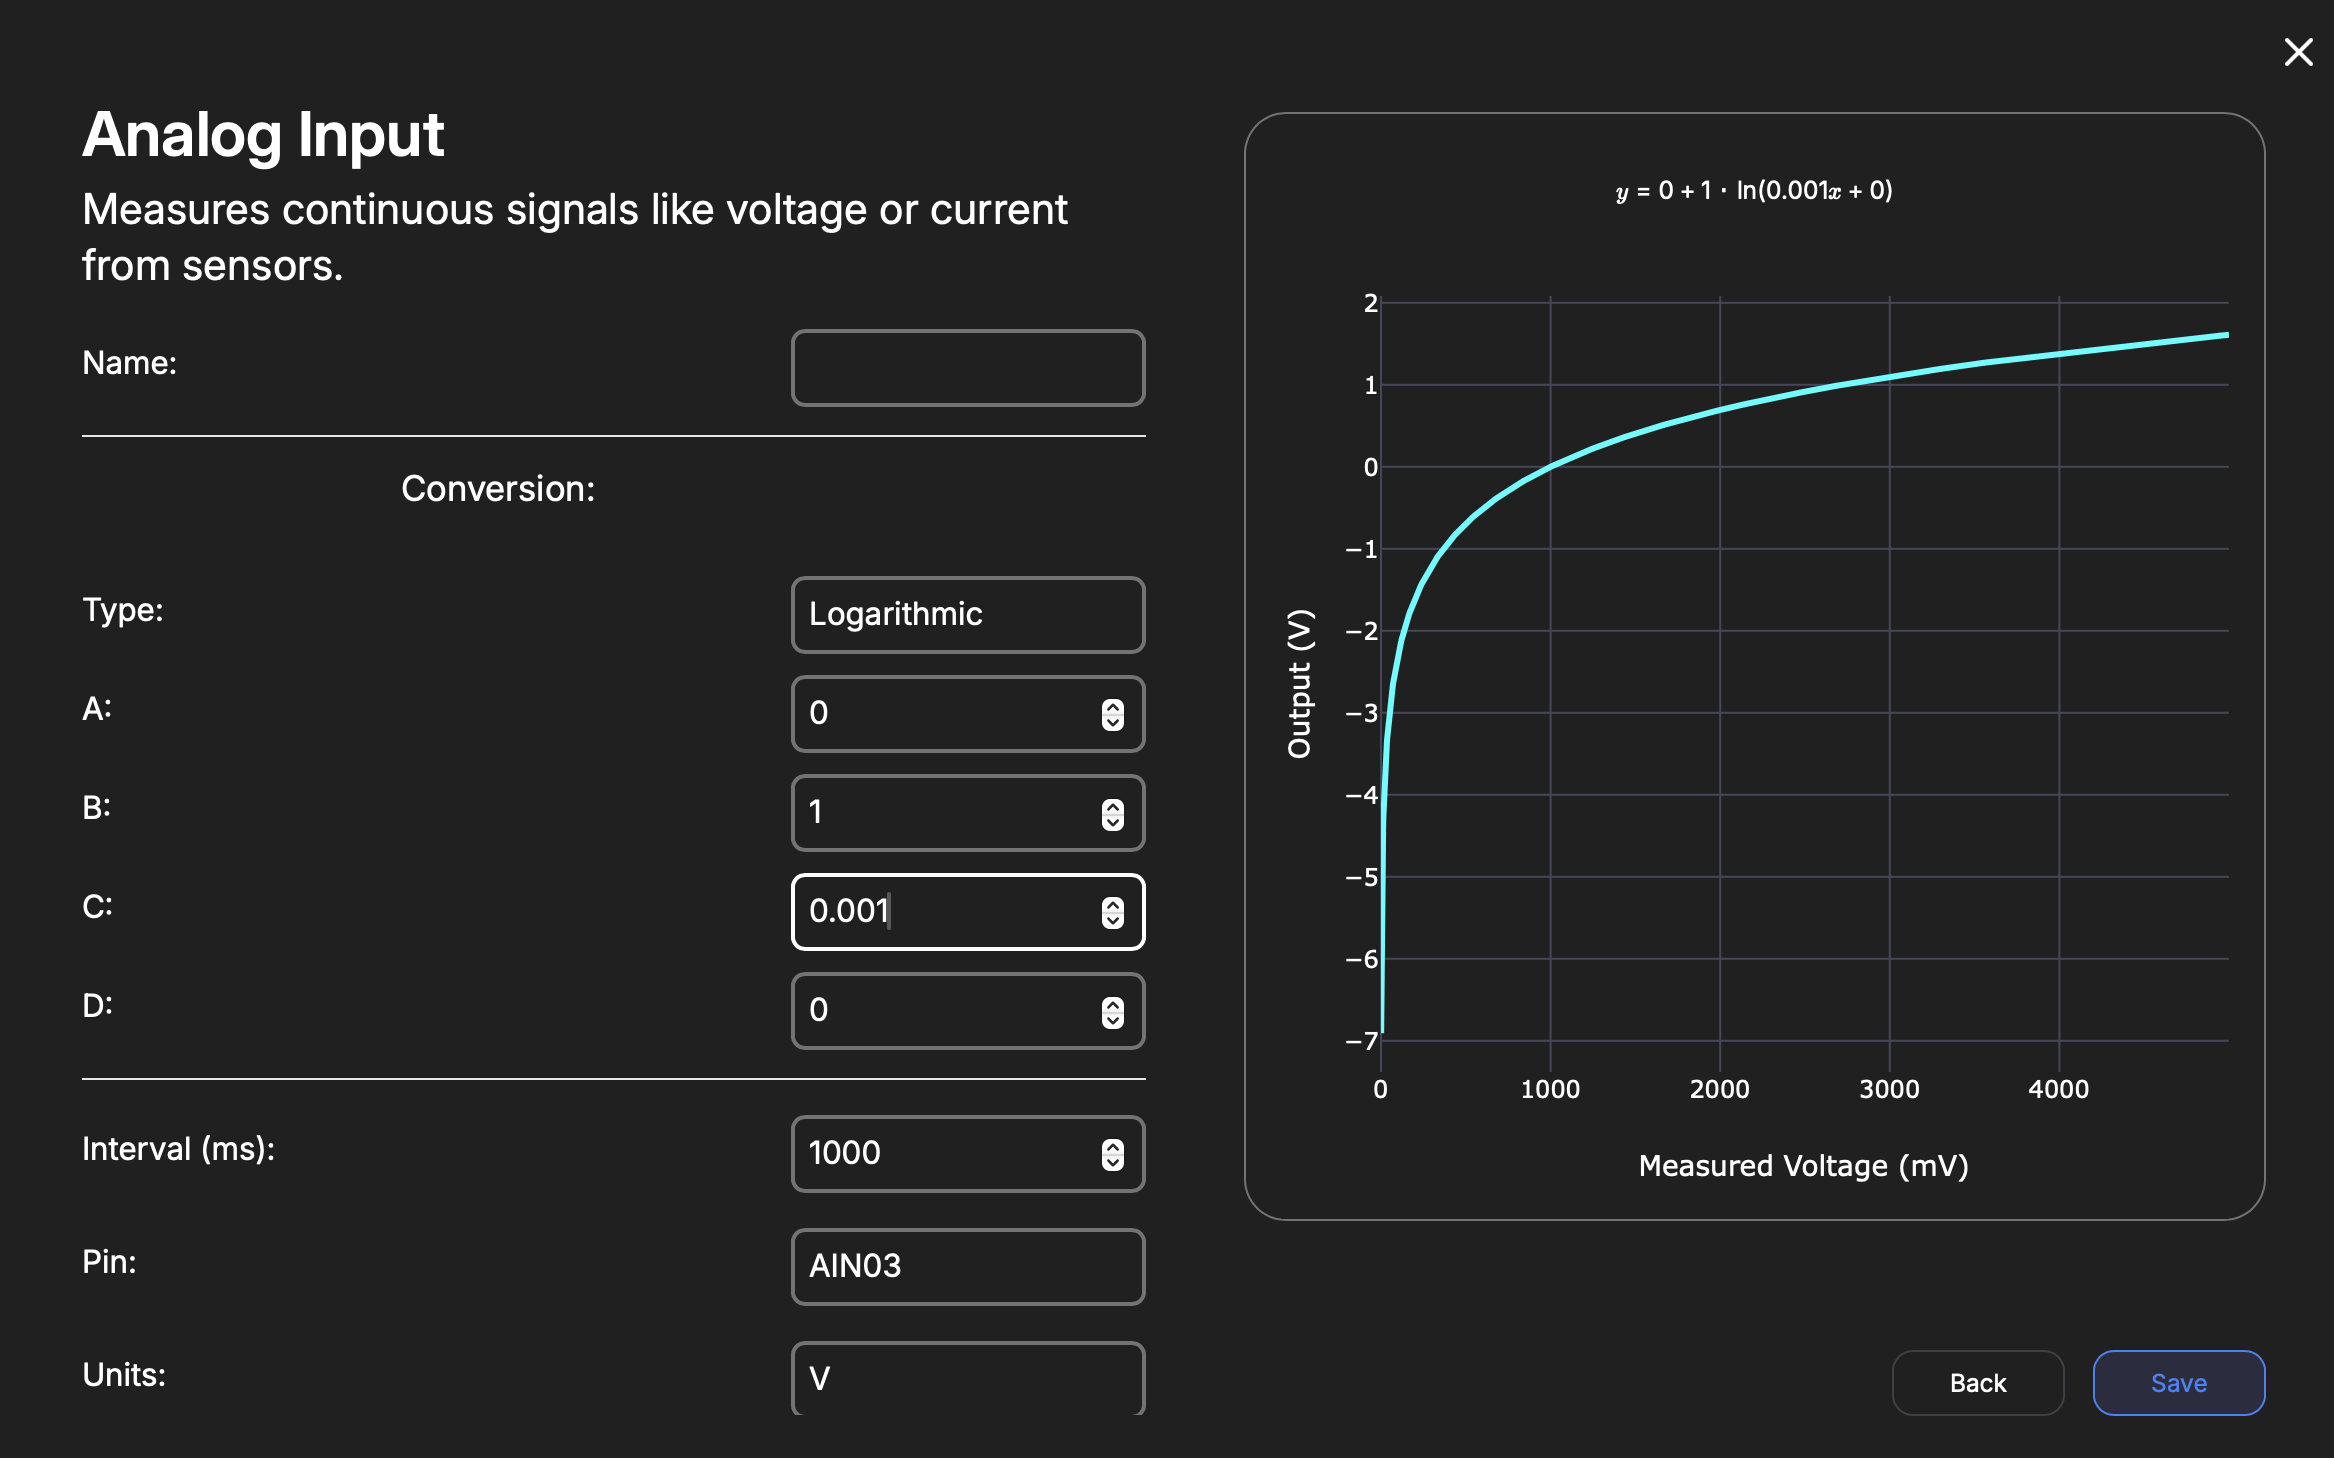
Analog Input
| Key | Type | Description |
|---|---|---|
| Name | String | Internal reference to task. |
| Type | Enum | Polynomial Logarithmic |
| A | Float | Conversion equation A coefficient |
| B | Float | Conversion equation B coefficient |
| C | Float | Conversion equation C coefficient |
| D | Float | Conversion equation D coefficient |
| Unit | String | Indicates unit of measurement. |
| Interval | Interval | Rate in milliseconds the task publishes a measurement to MQTT. |
| Pin | Enum | Chosen Analog Input Pin (AIN00-AIN07). |
| Comment | String | Comment to help user understand what this service is about. |
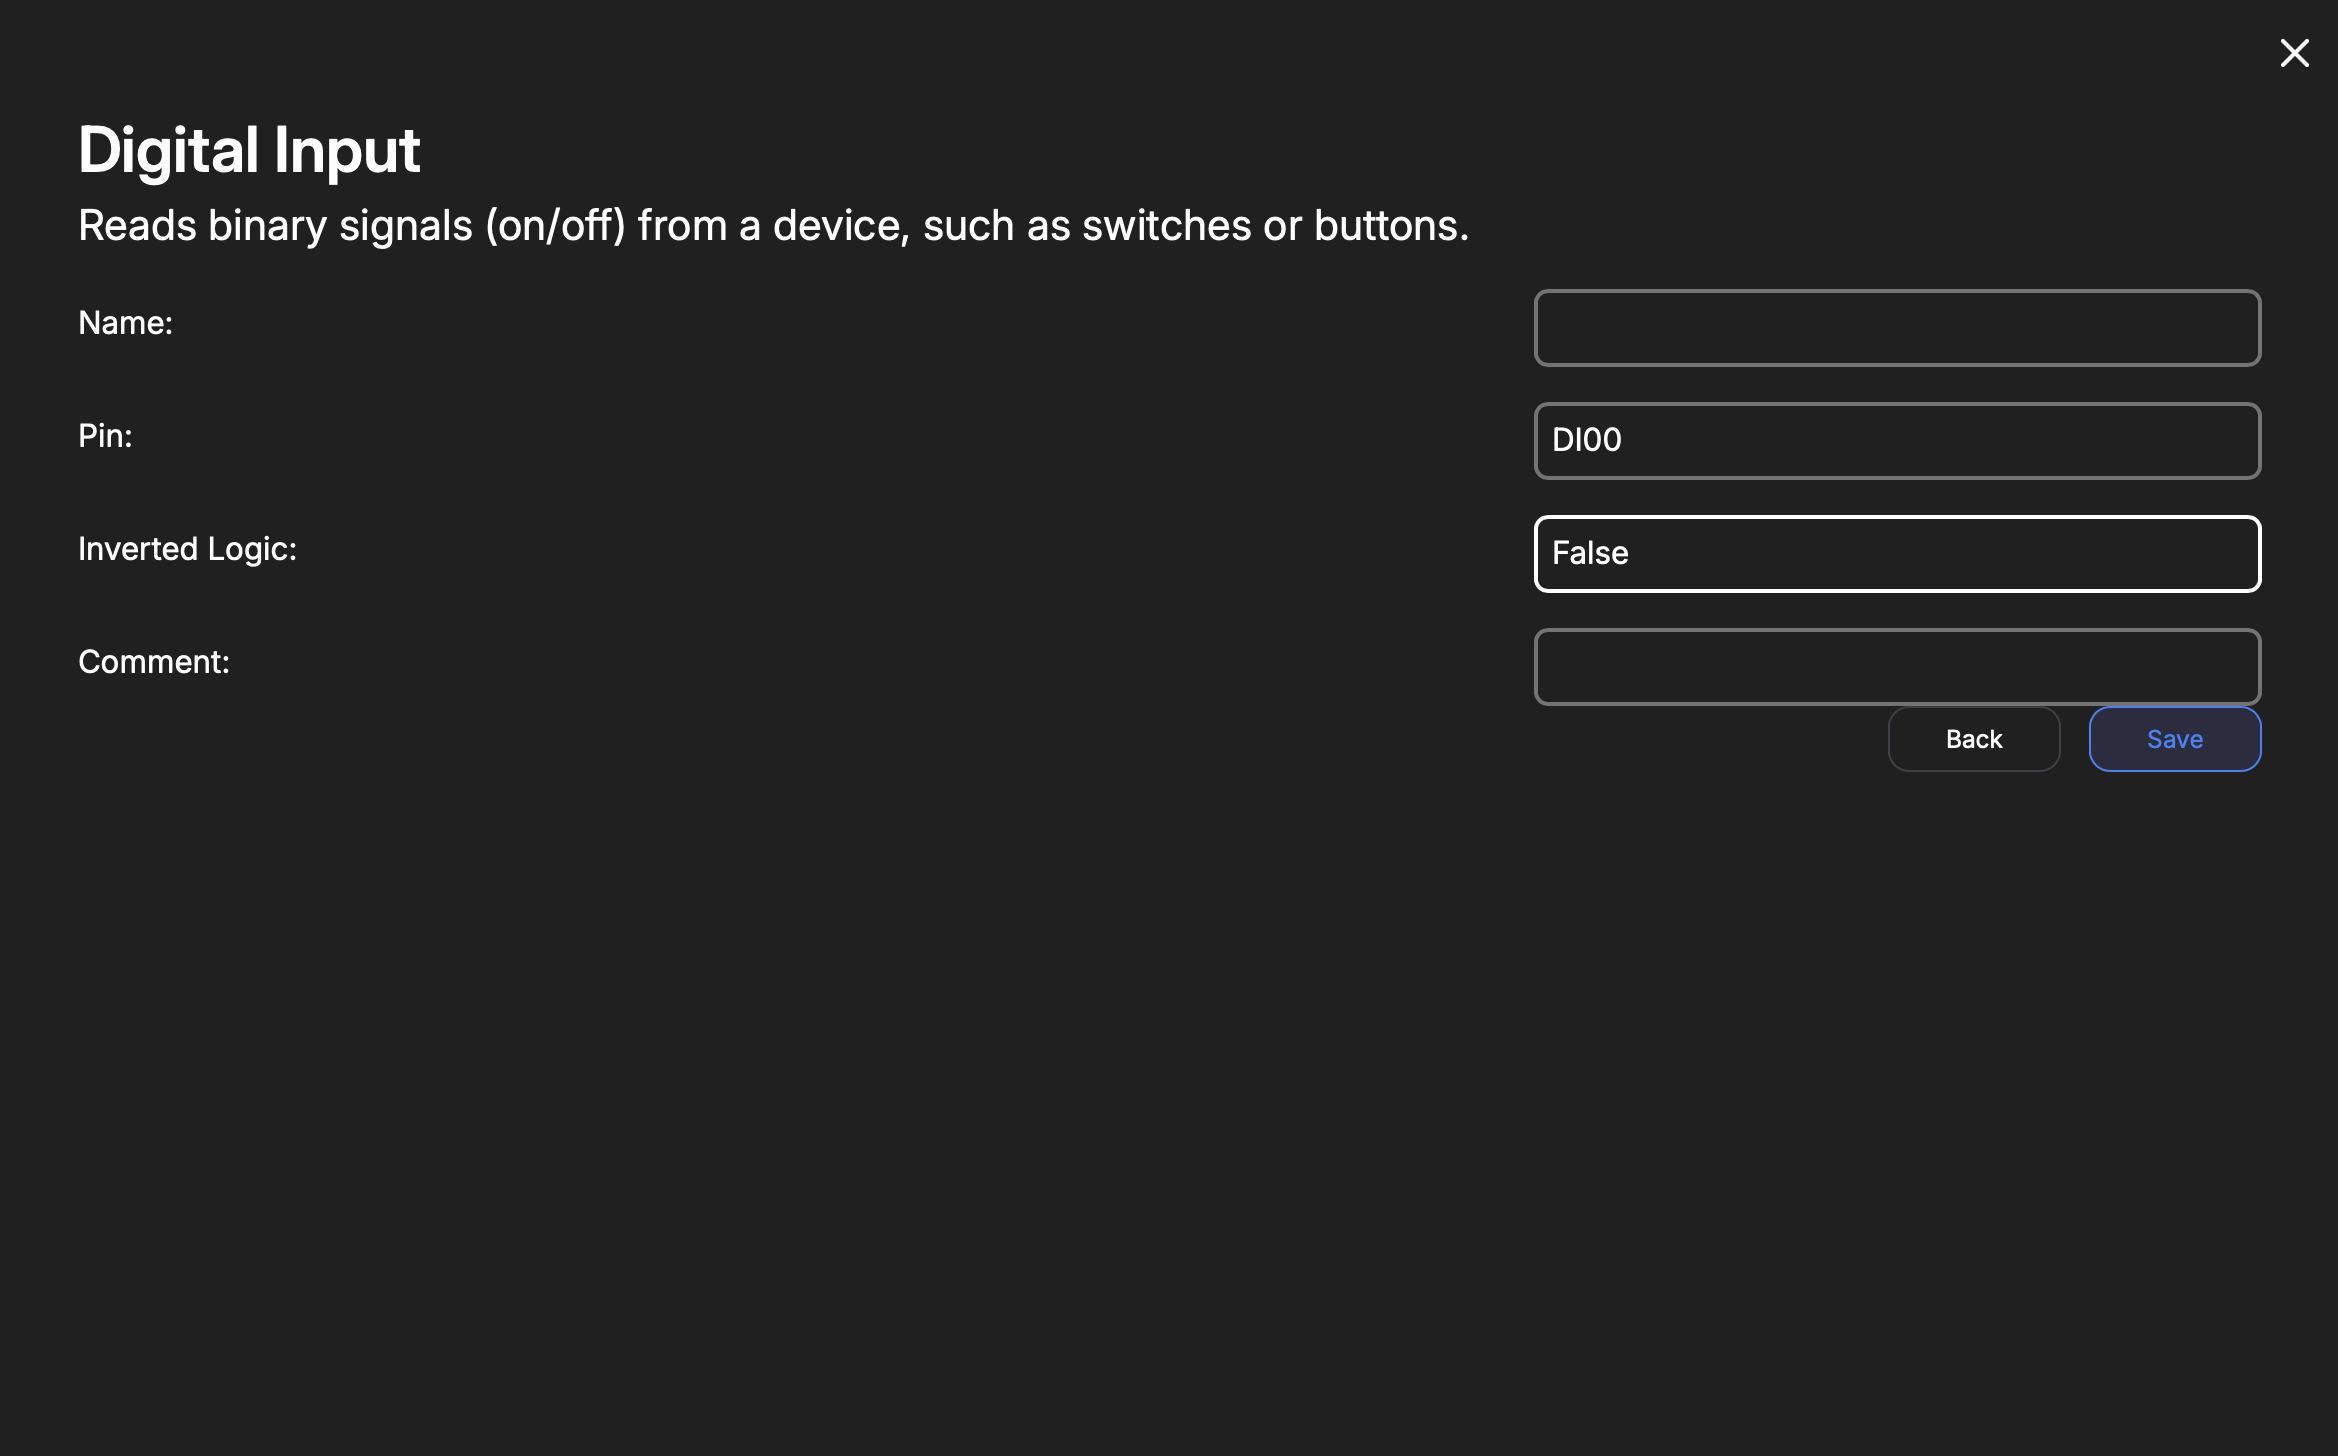
Digital Input
| Key | Type | Description |
|---|---|---|
| Name | String | Internal reference to task. |
| Pin | Enum | DI00 - DI15 |
| Inverted Logic | Boolean | Is the input an active-high? Set to false. Otherwise, set to true. |
Frequency Counter
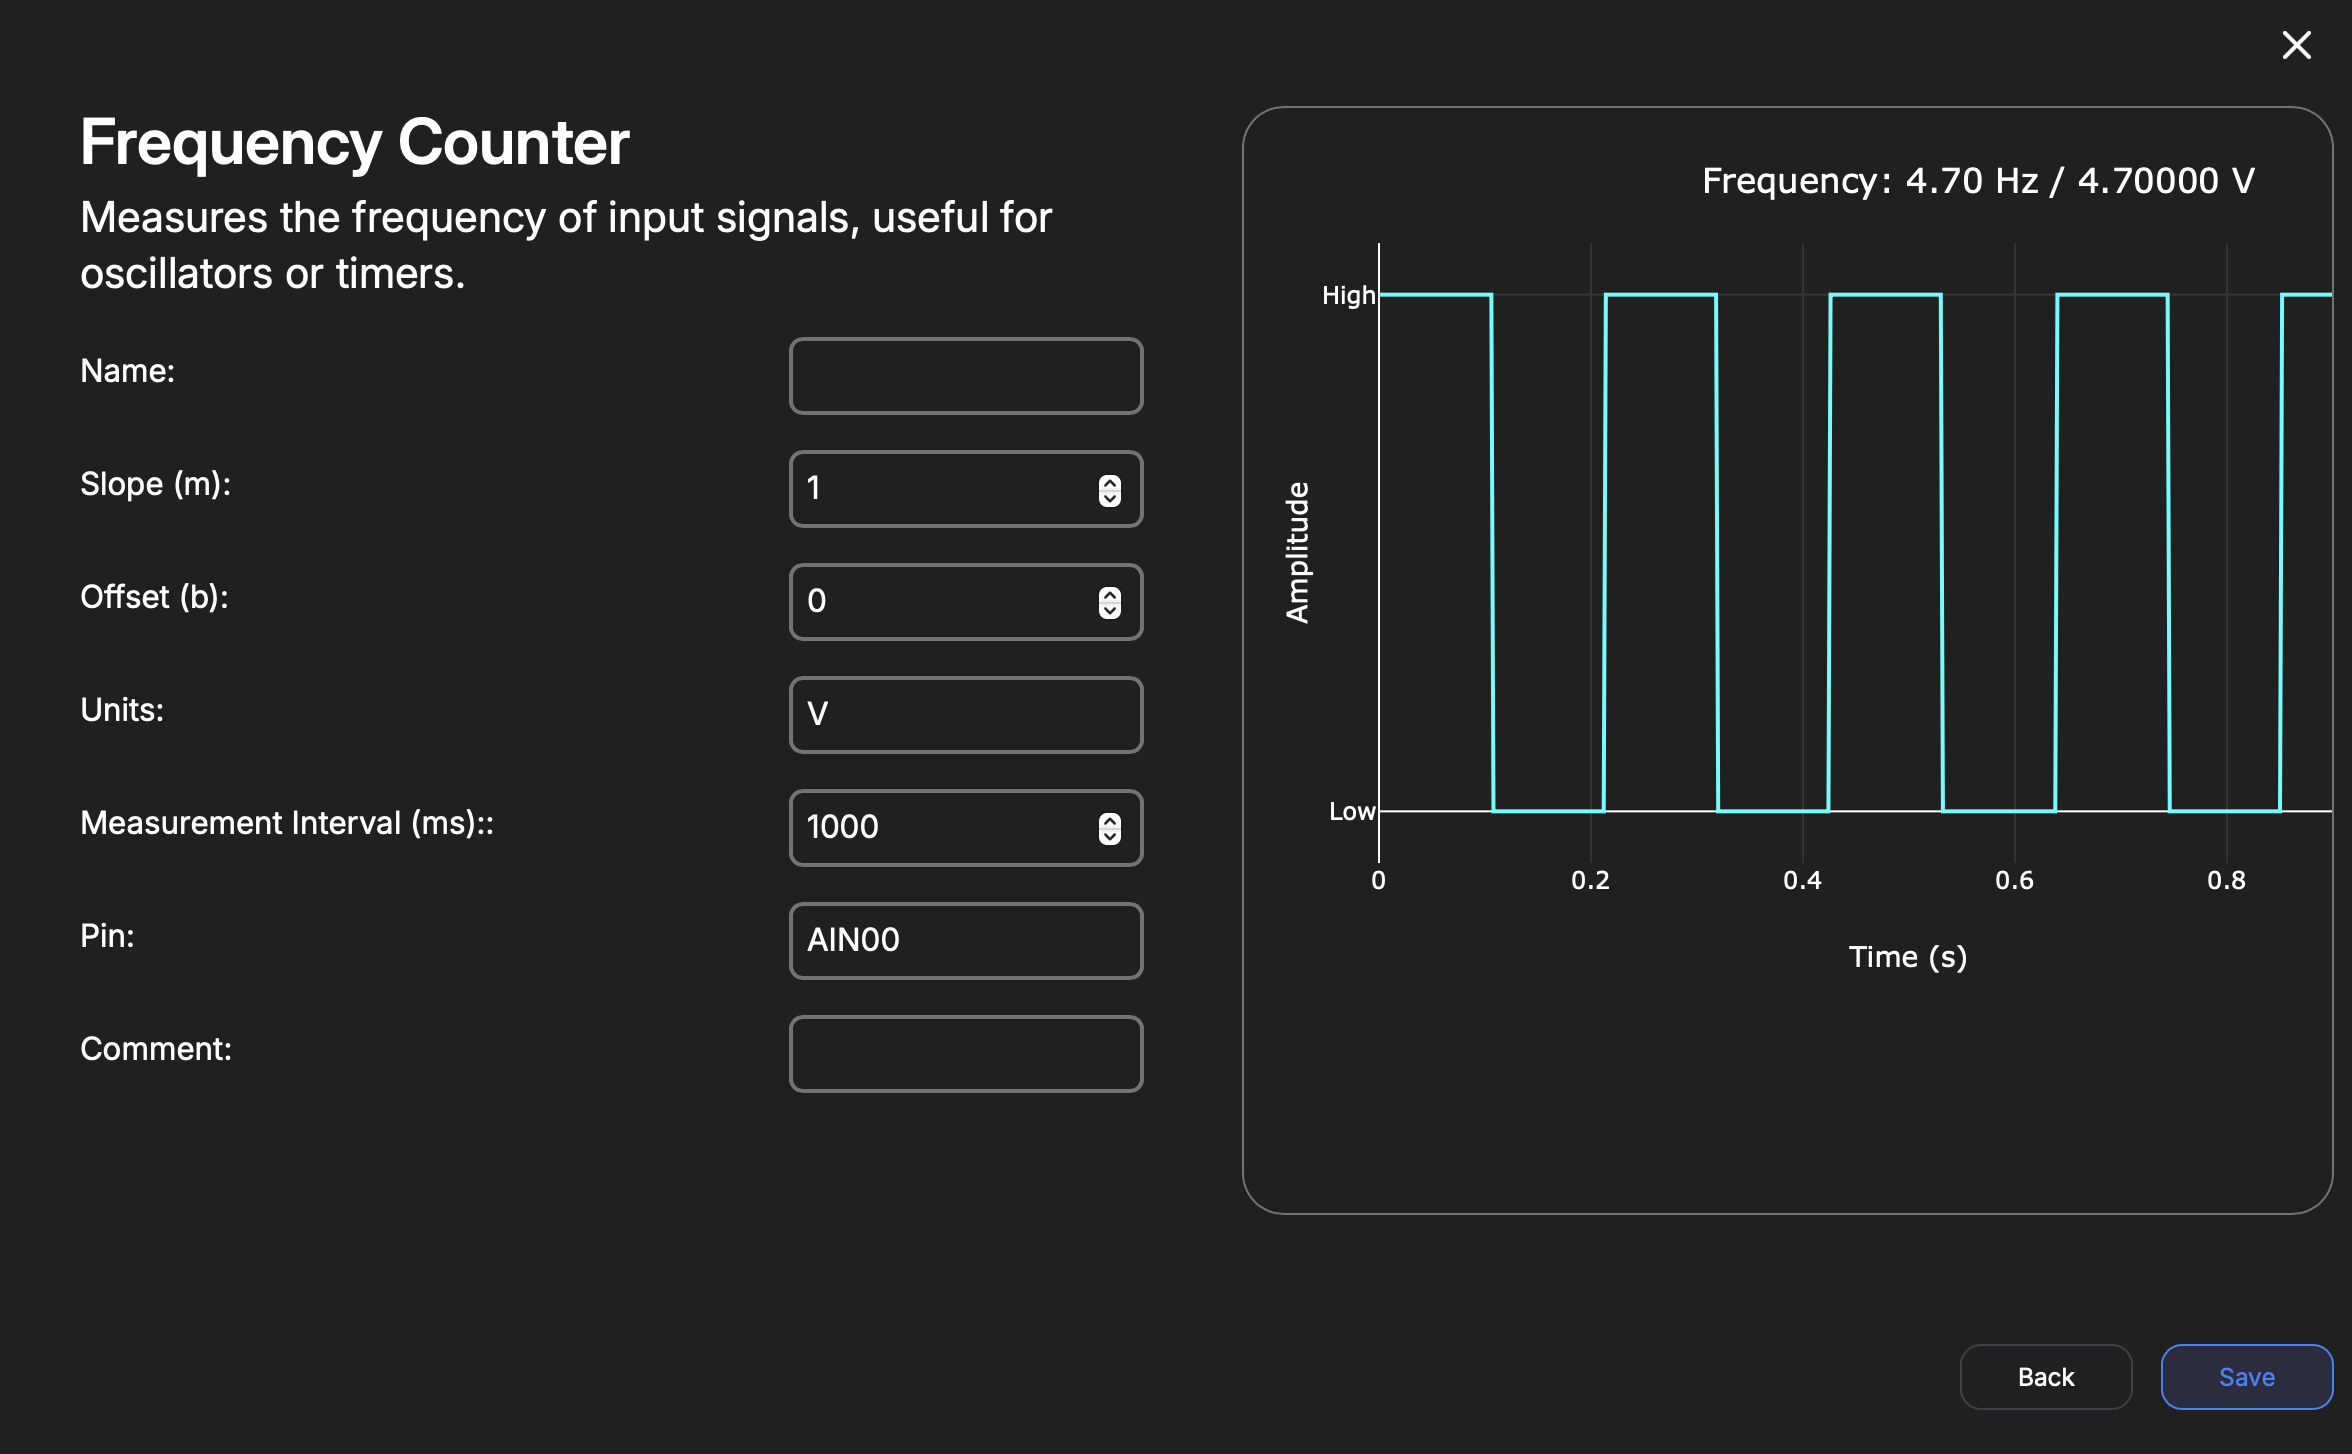
| Key | Type | Description |
|---|---|---|
| Name | String | Internal reference to task. |
| Slope | Float | Y = mX + b, m = Slope, x = millivolts measured.This is used to provide unit conversion (e.g. turning mV to PSI). The user determines this. The output, “Y”, is the unit-converted reading. |
| Offset | Float | mV to unit zero-offset. ‘b’ in the above equation. |
| Unit | String | Indicates unit of measurement. |
| Interval | Interval | Rate in milliseconds the task publishes a value to MQTT. |
| Pin | Enum | Chosen Digital or Analog Input Pin (AIN00-AIN07, DI0-DI5). |
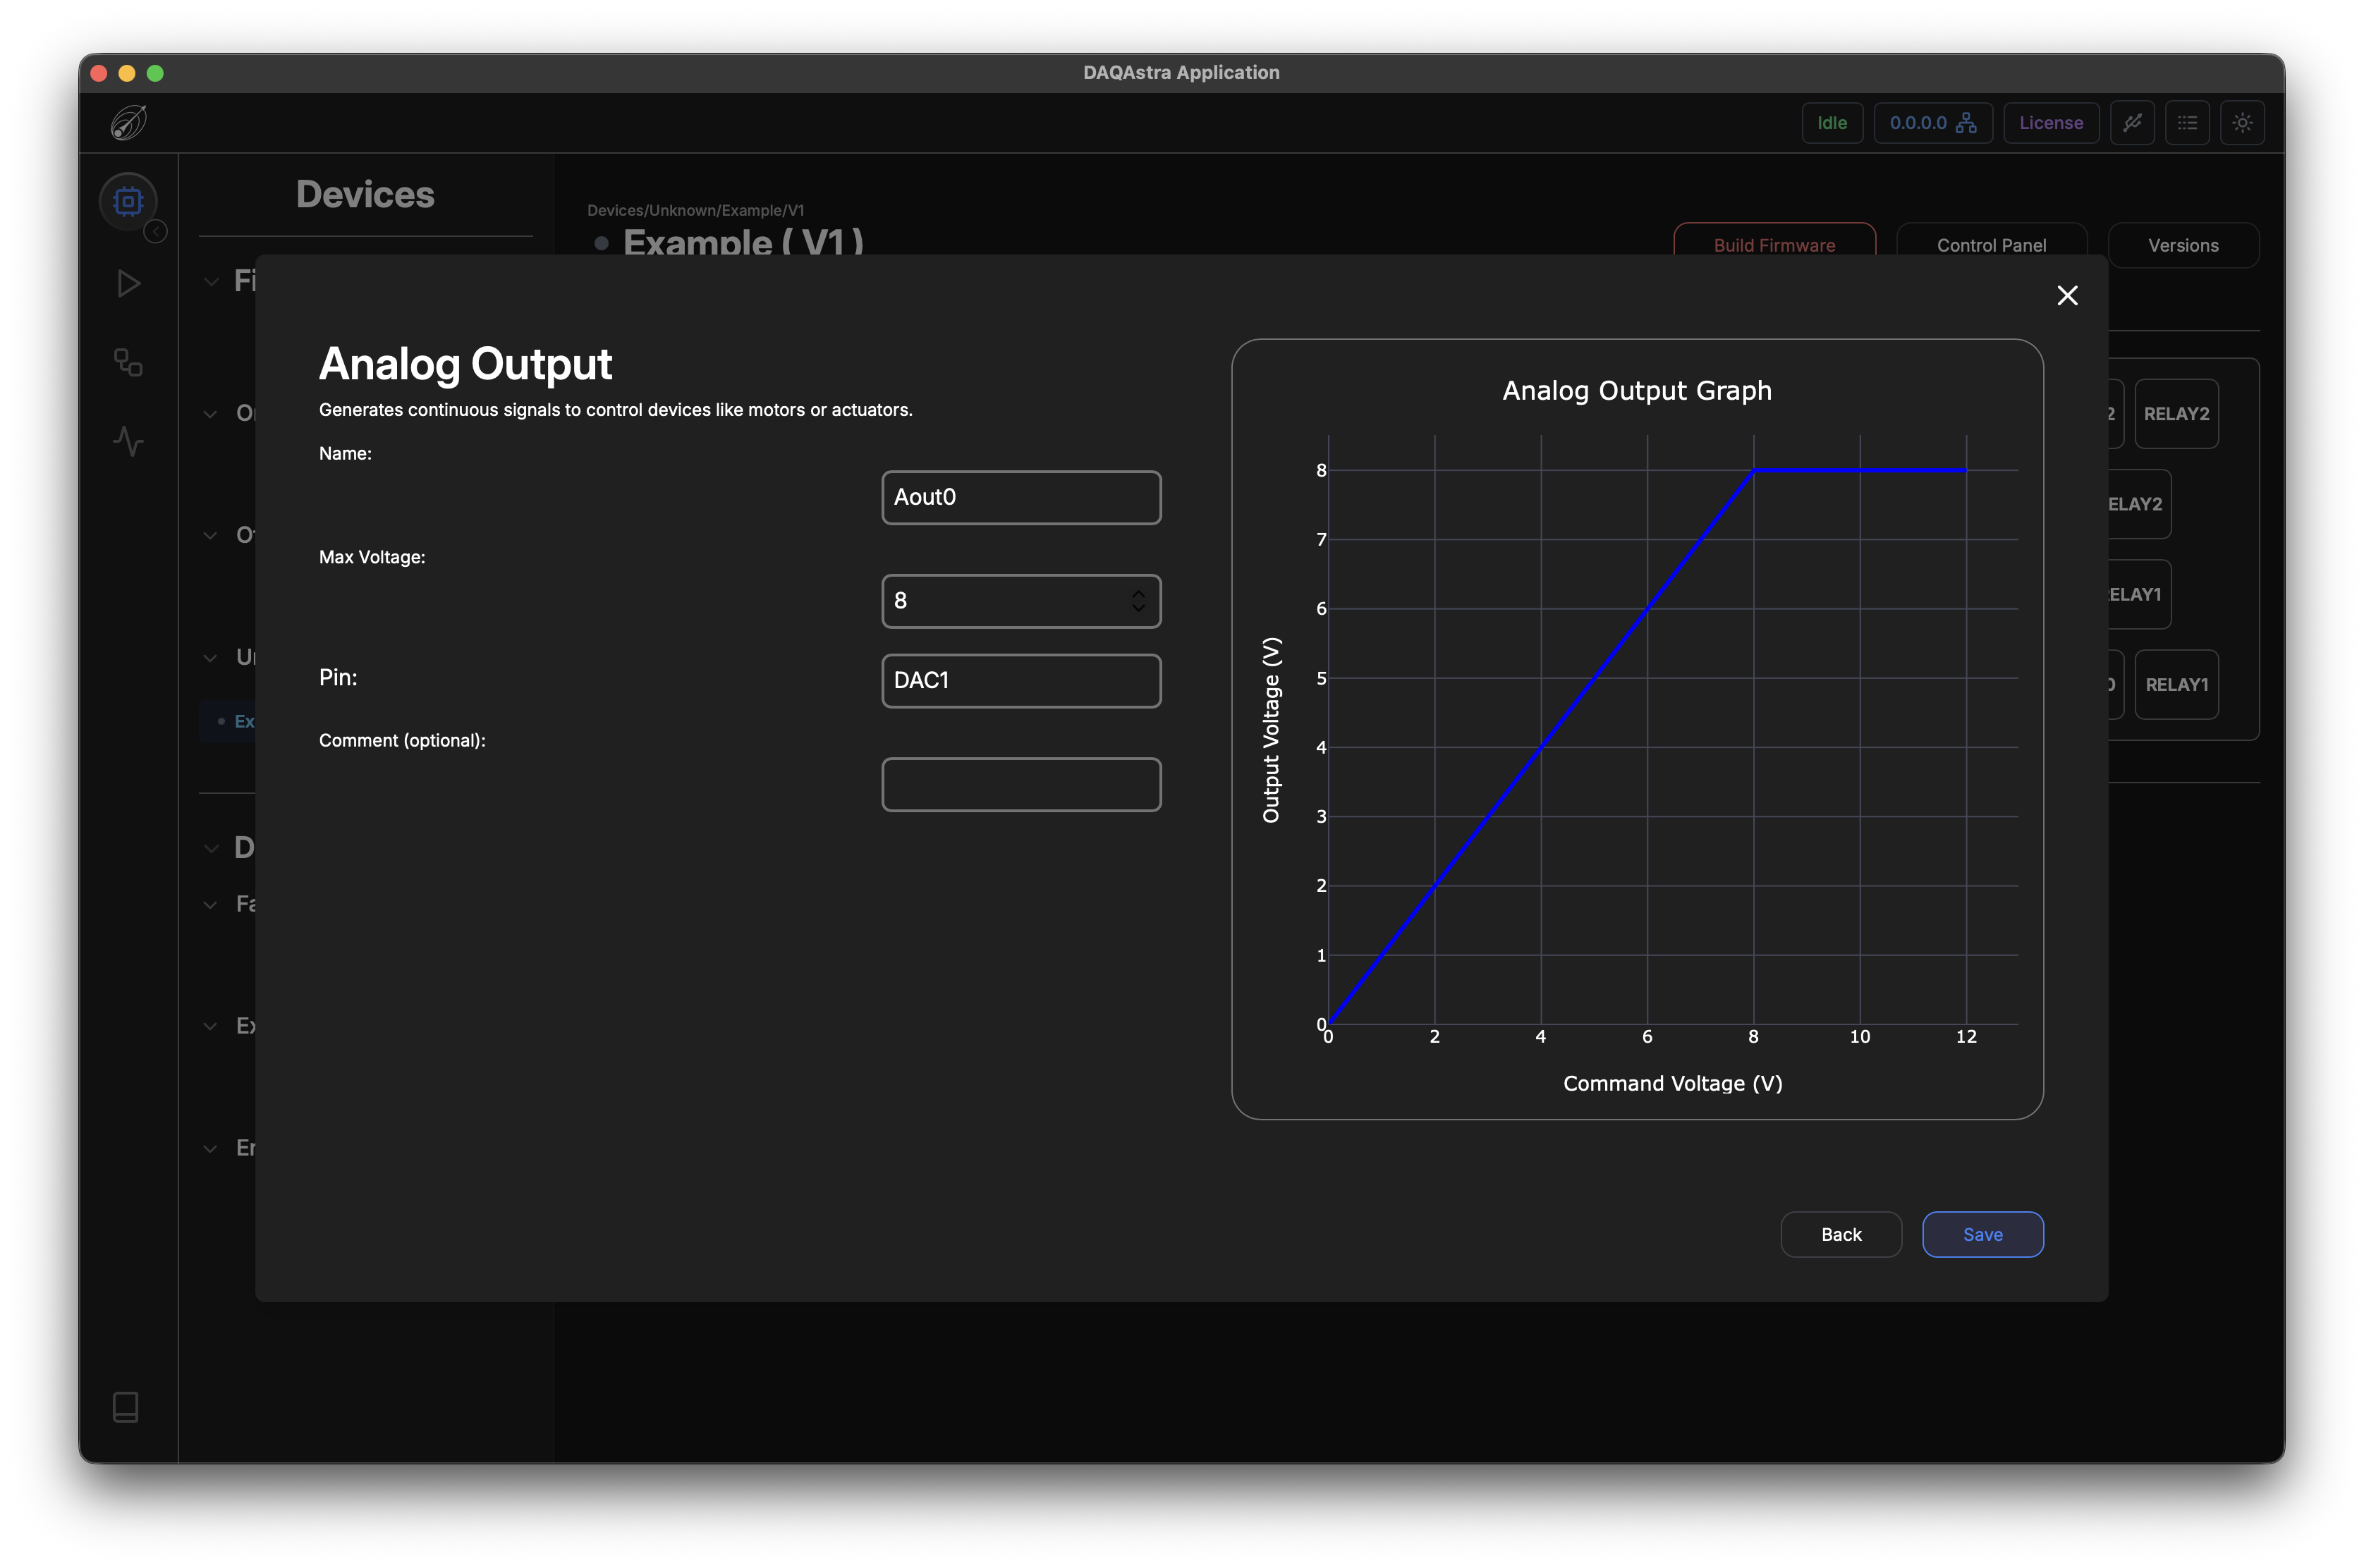
Analog Output
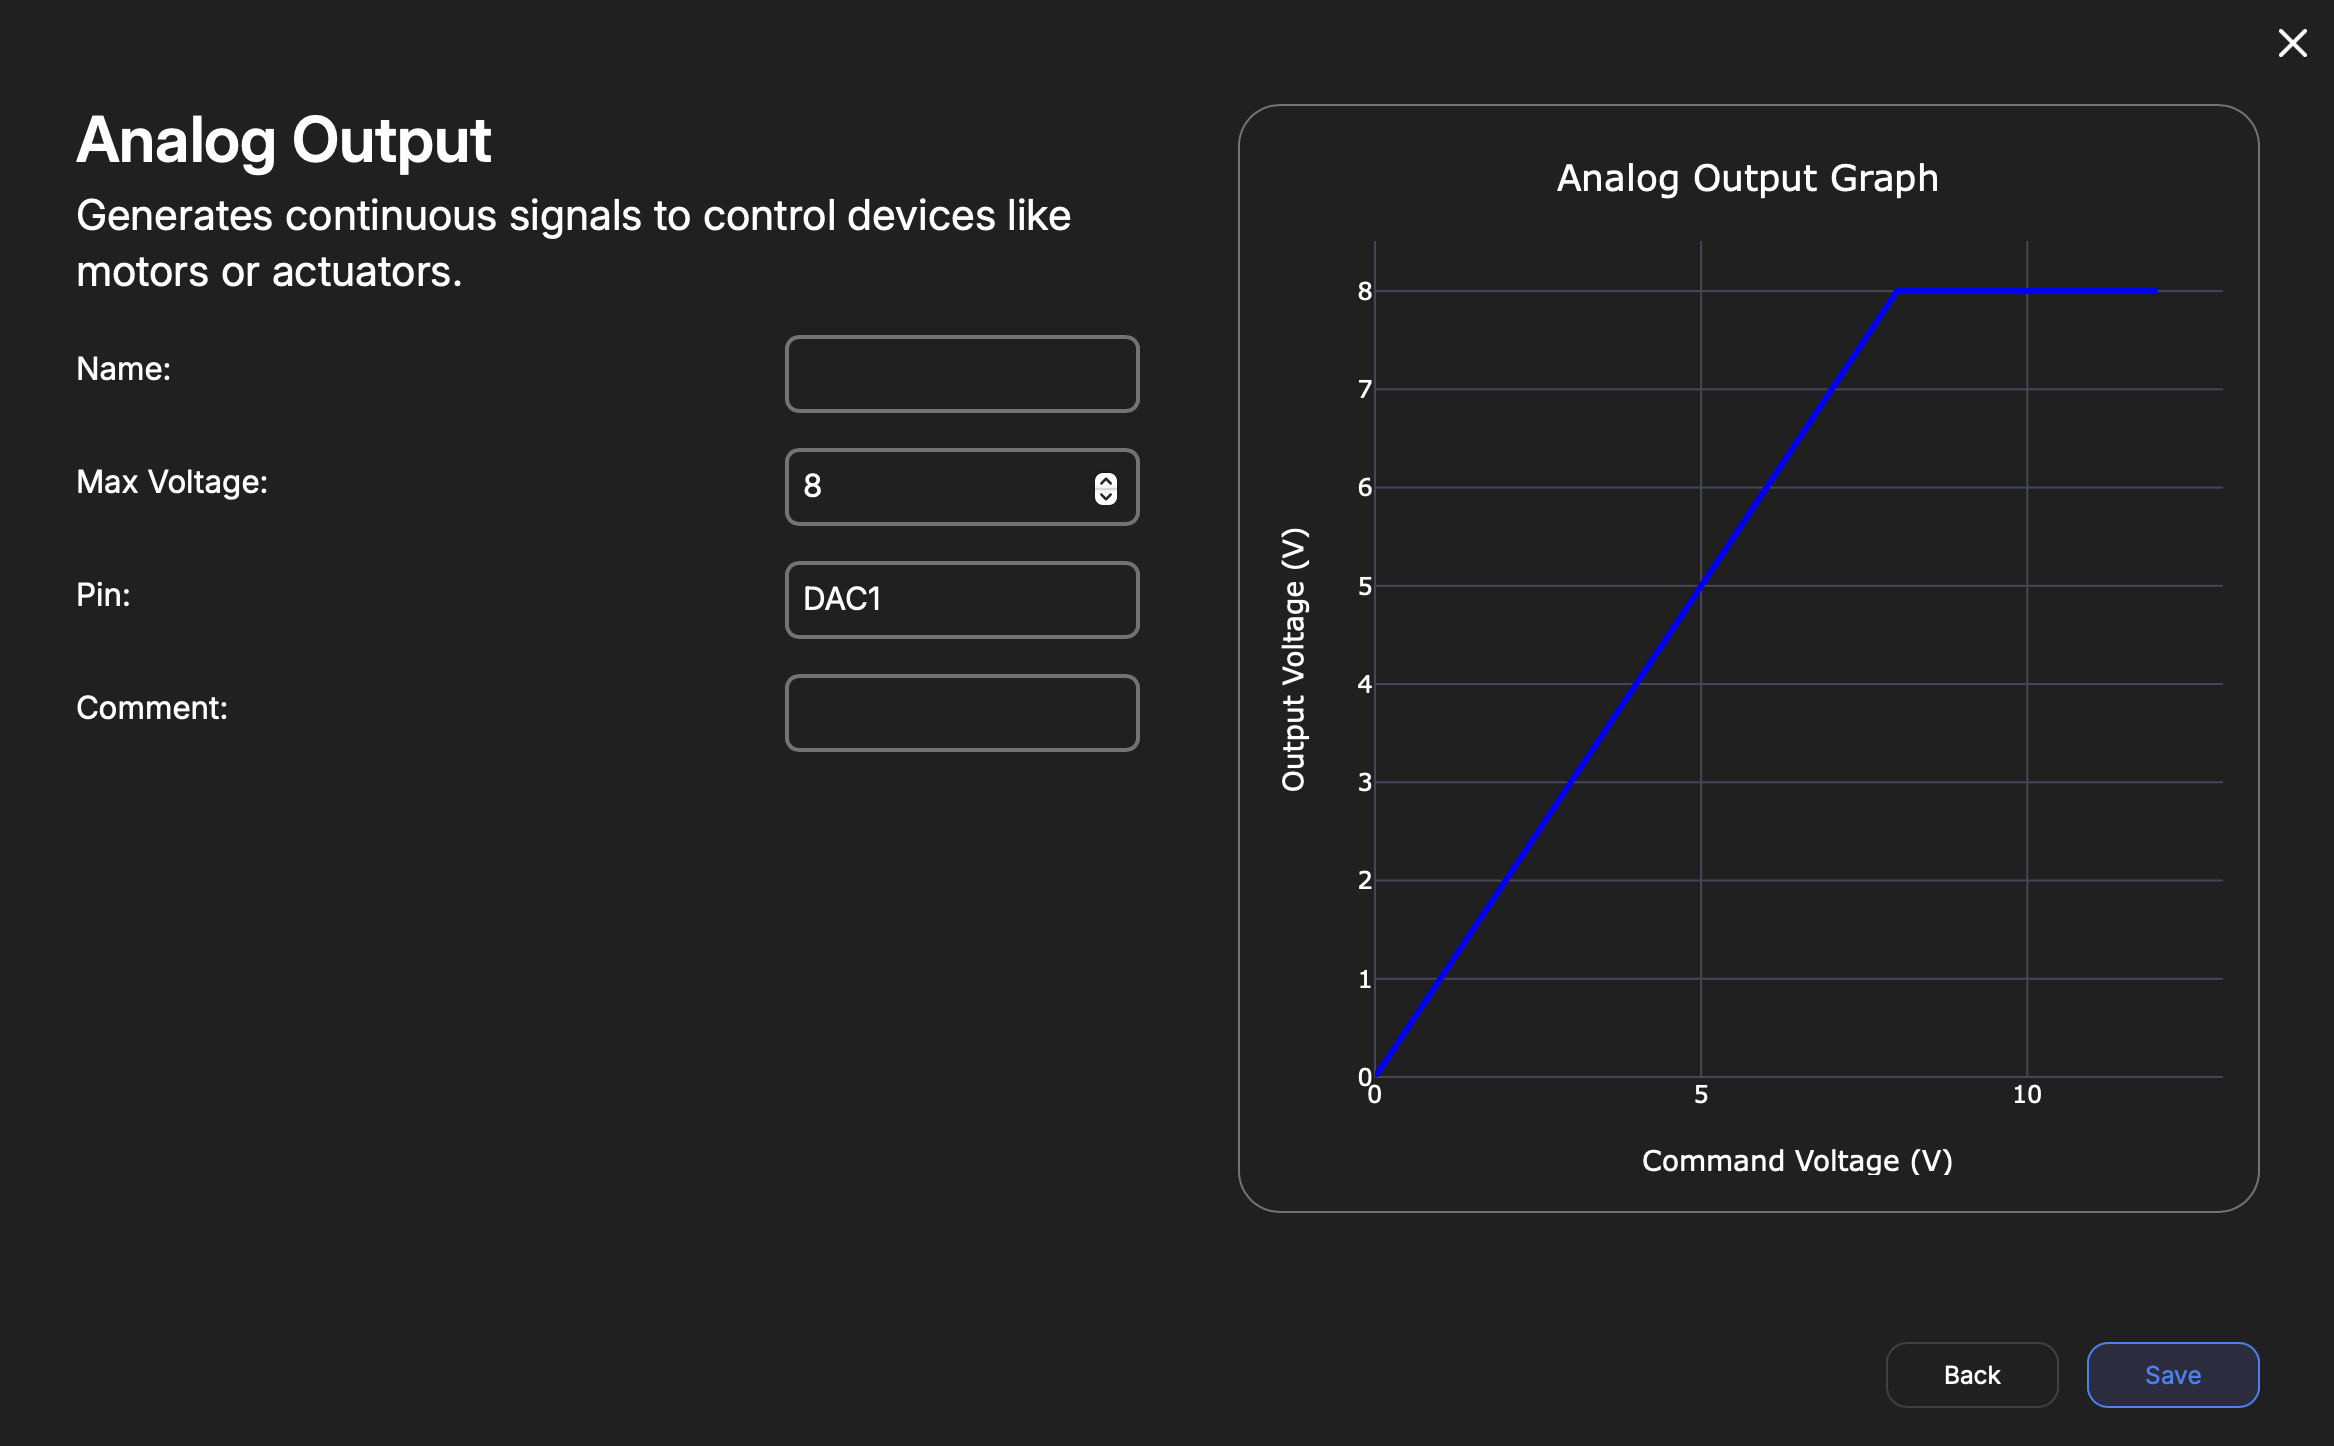
The user can move the jumper labeled
DAC VCCto either use 5V or 12V to set a hardware limit. Do this only with the DAQAstra powered off.
| Key | Type | Description |
|---|---|---|
| Name | String | Internal reference to task. |
| Max Voltage | Float | A software upper-limit on voltage that the DAC will output. Maximum is 12VDC. |
| Pin | Enum | [DAC1, DAC2] |
Digital Output
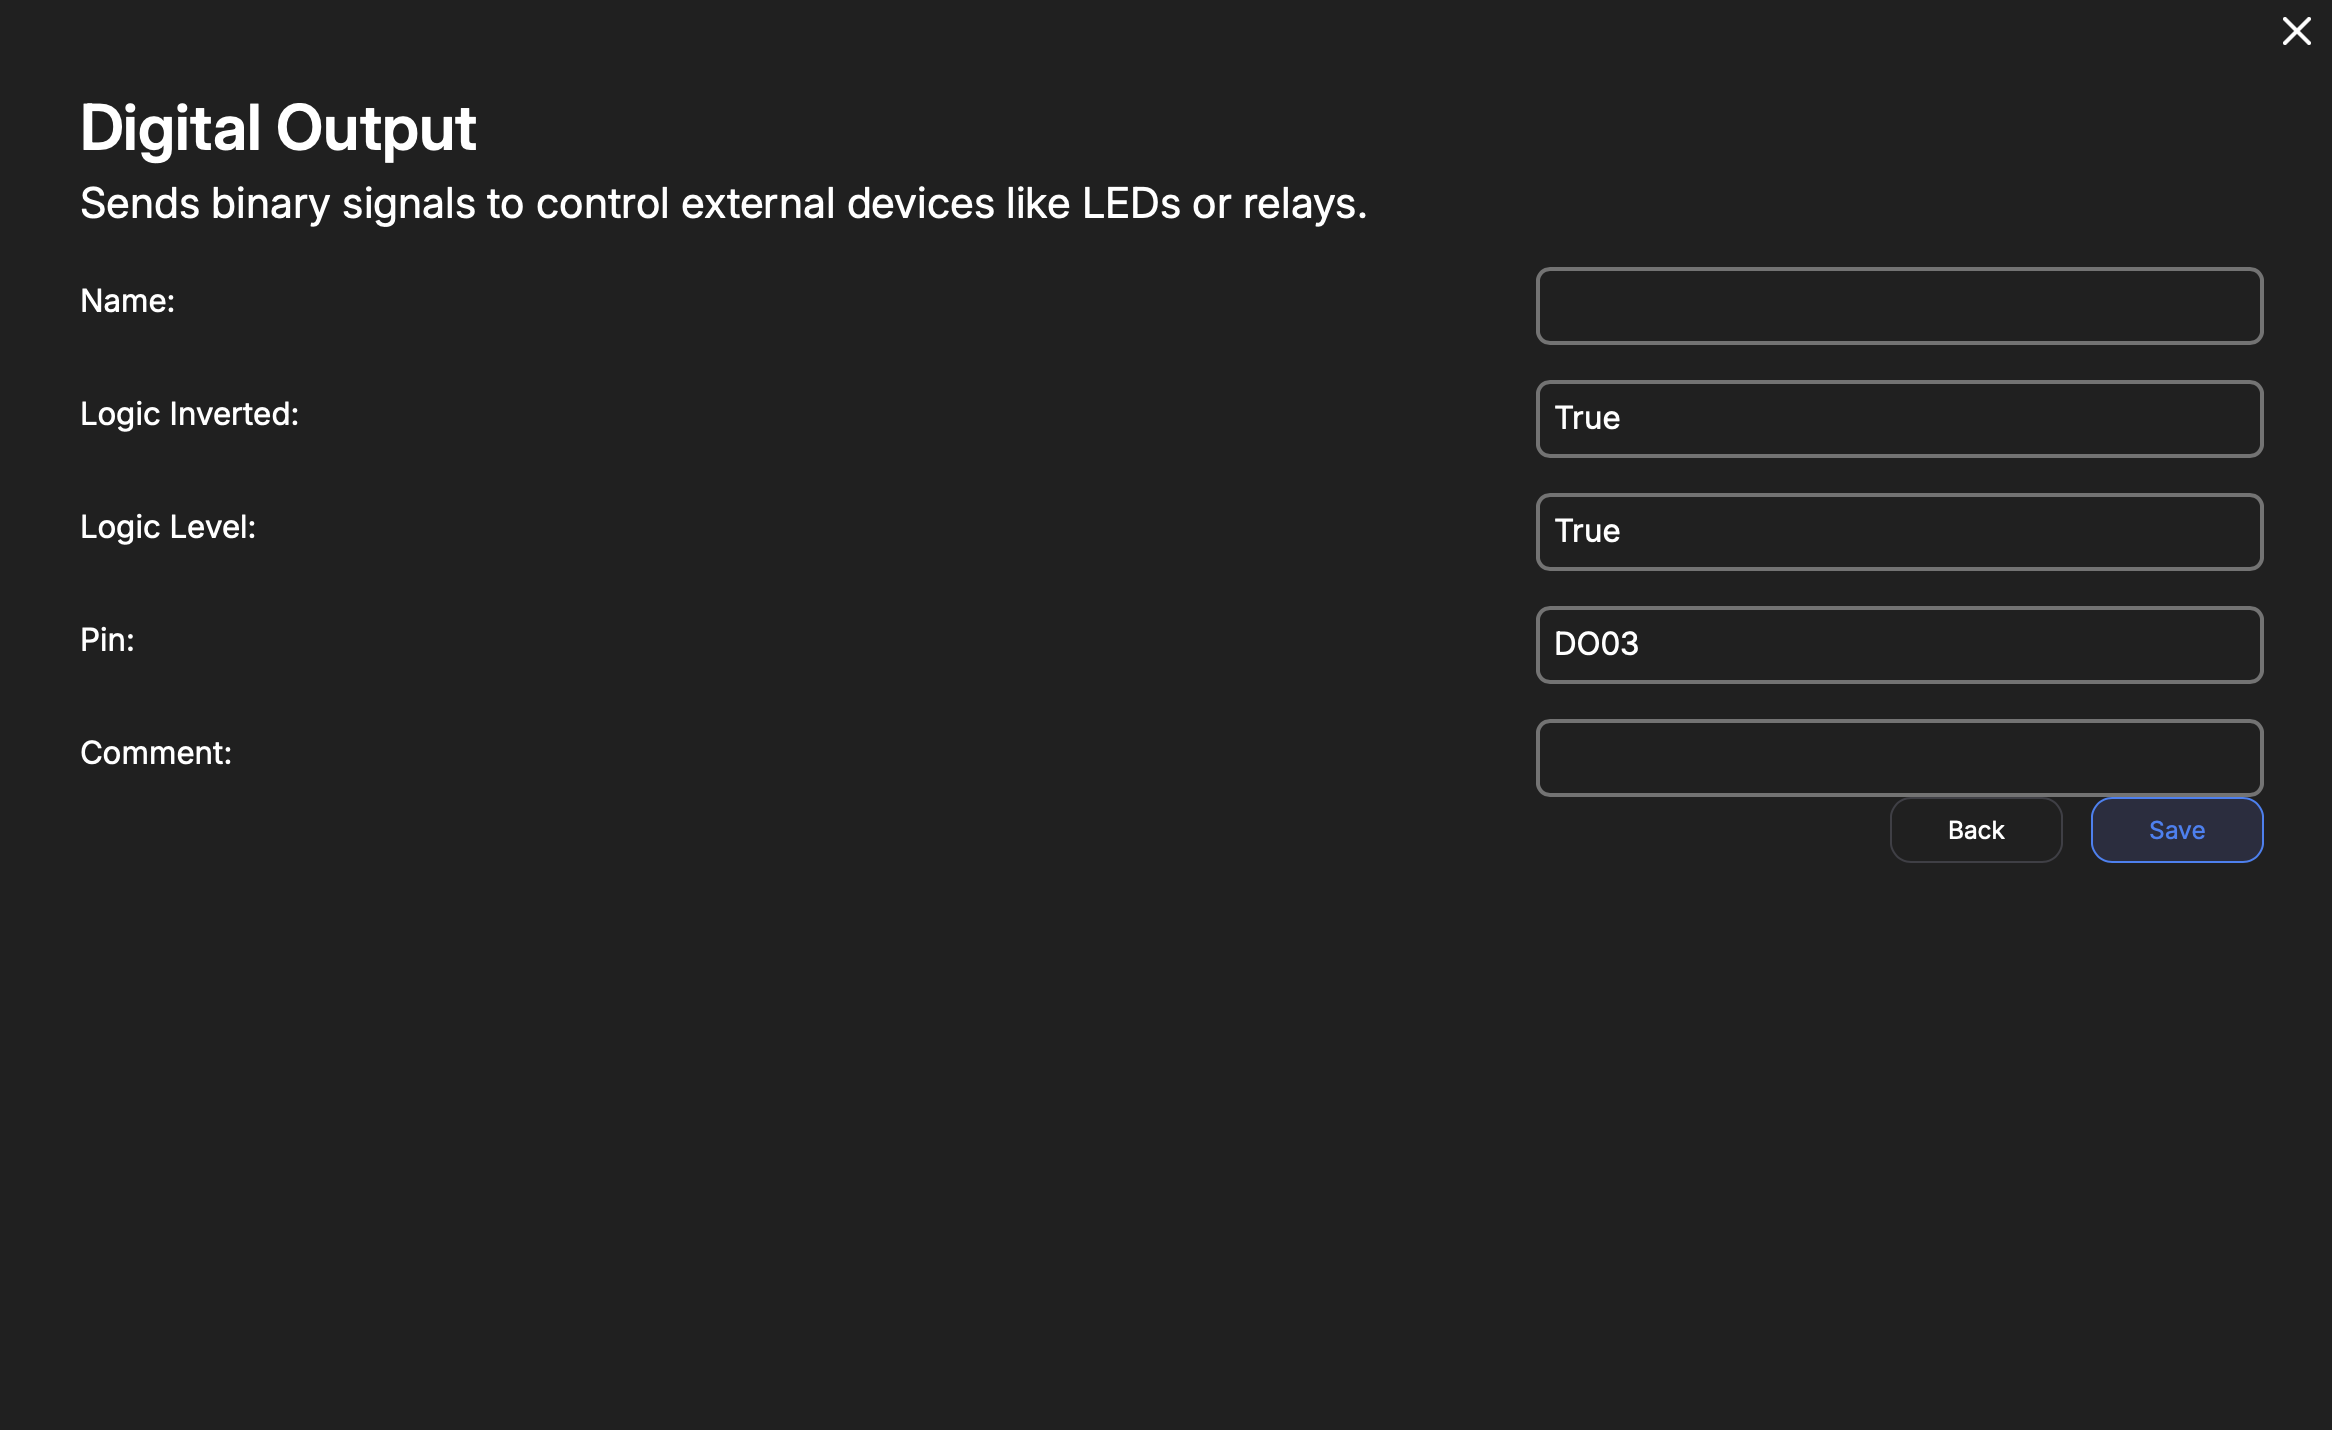
| Key | Type | Description |
|---|---|---|
| Name | String | Internal reference to task. |
| Logic Level | Boolean | The logic-level at boot. |
| Logic Inversion | Bool | Whether the command logic should be inverted. True means logic-low is 'on'. |
| Pin | Enum | DO00-DO09, RELAY0-RELAY3 |
PWM Output
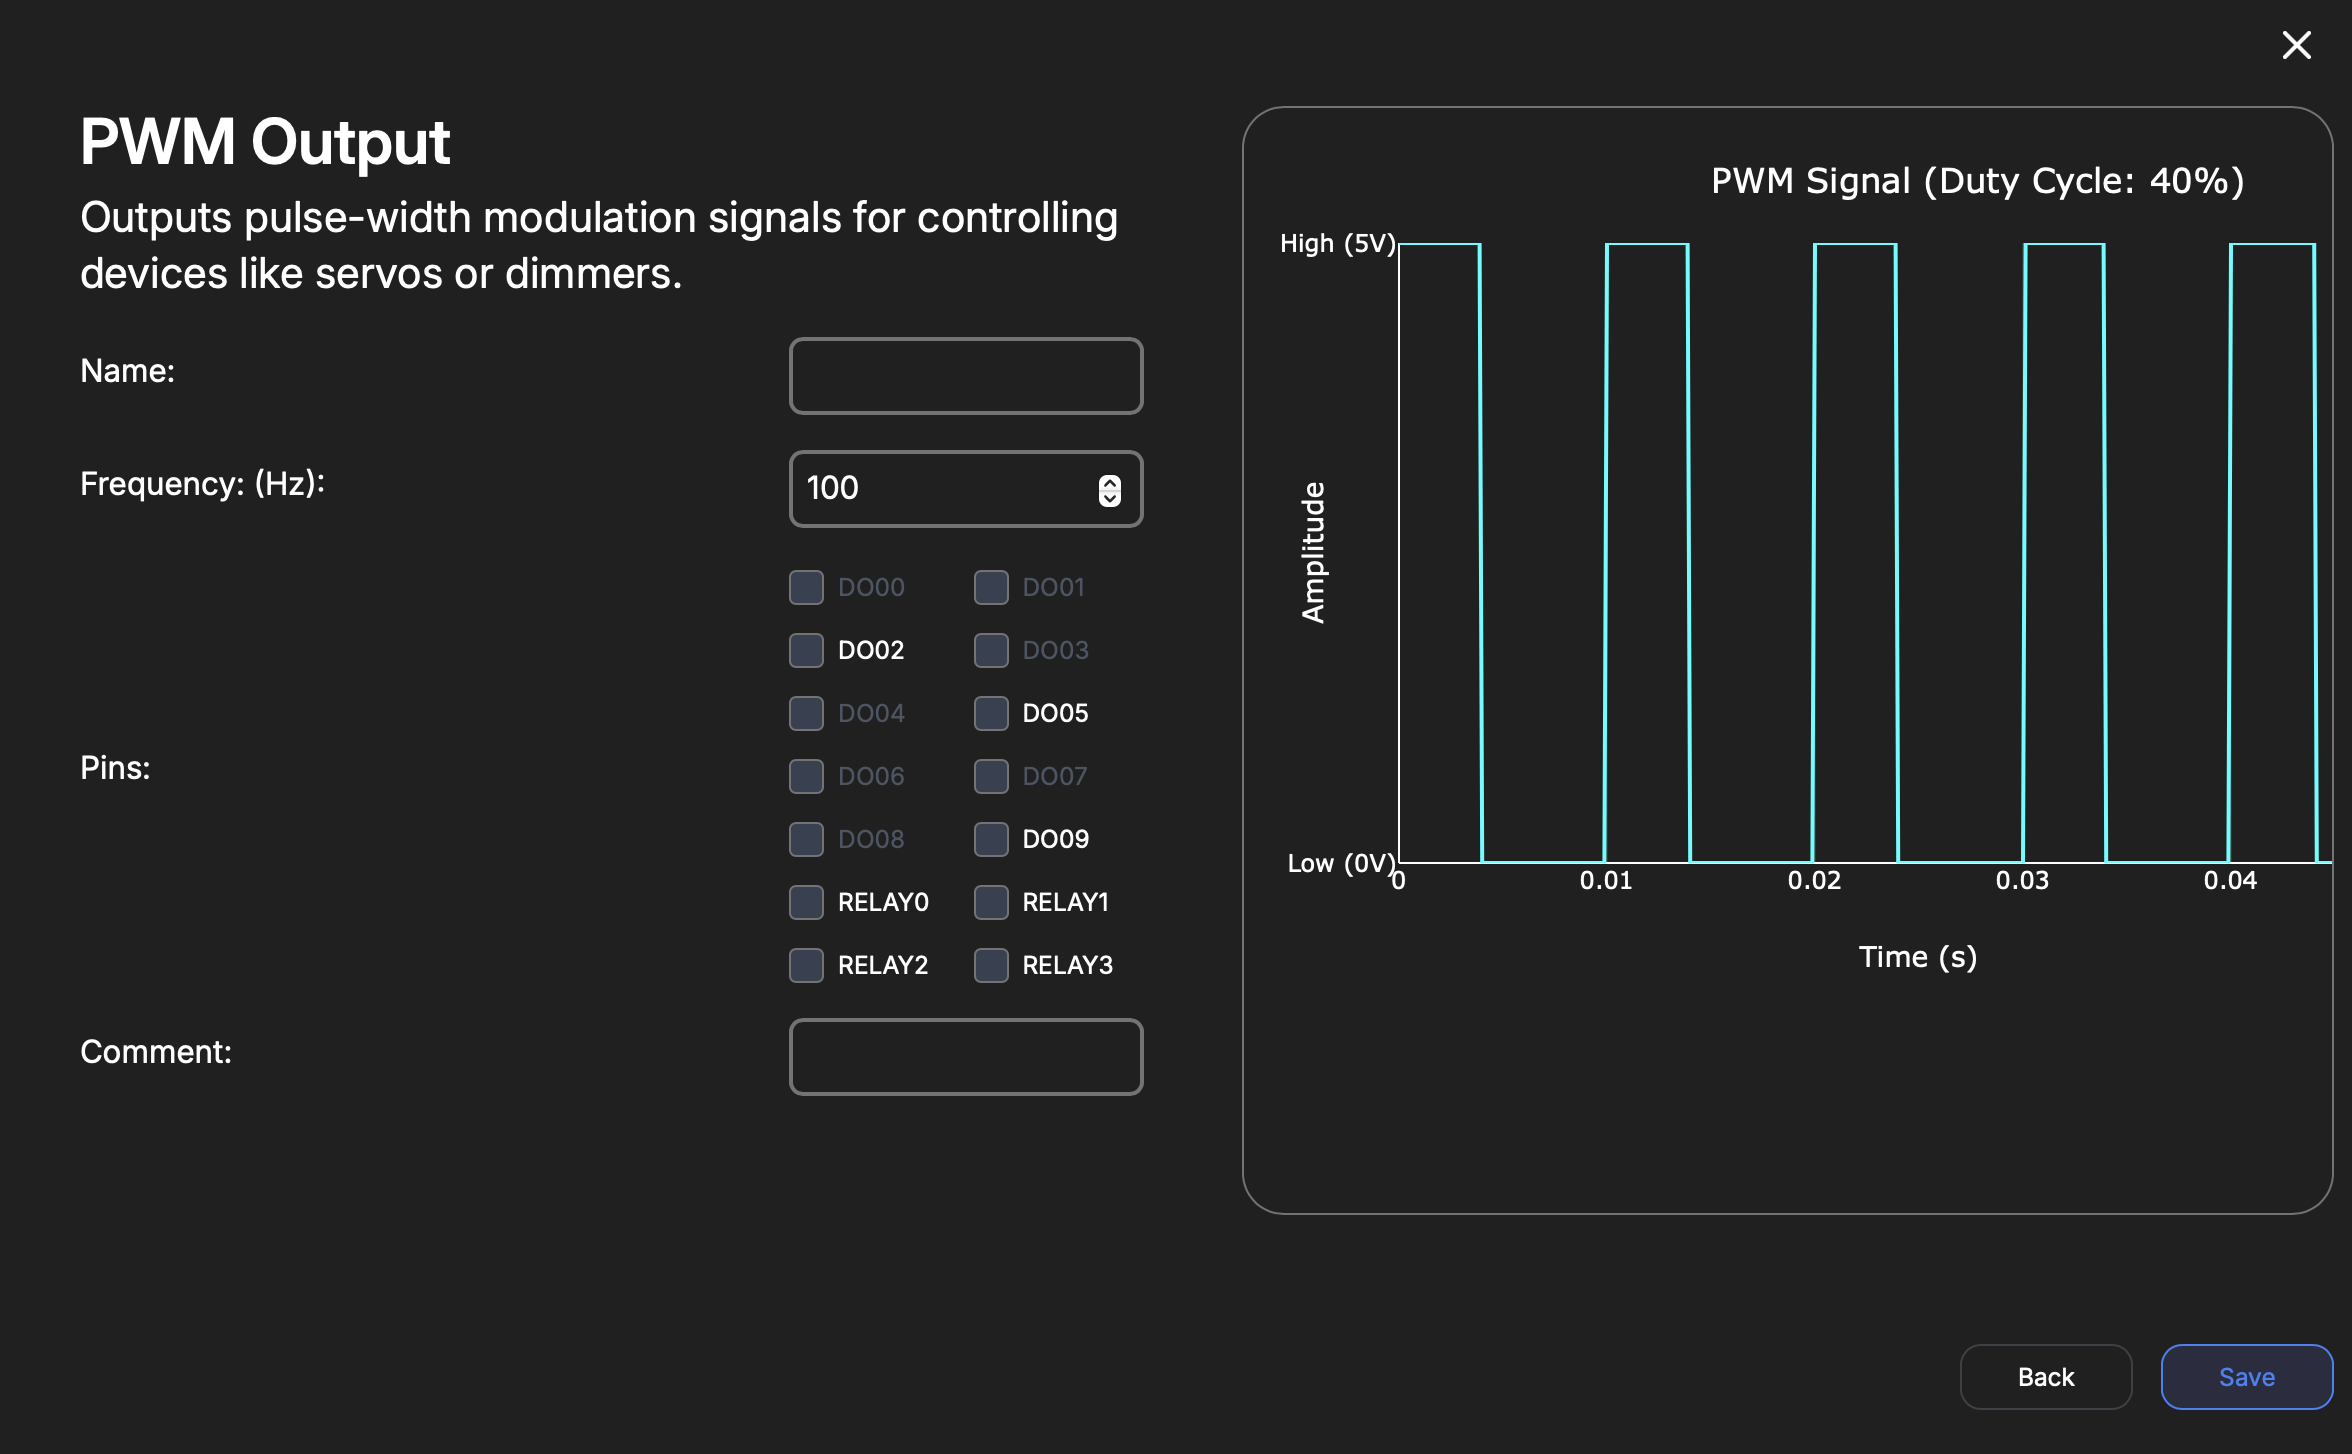
| Key | Type | Description |
|---|---|---|
| Name | String | Internal reference to task. |
| Frequency | Number | Default PWM frequency at boot. |
| Pin | Array(Enum) | Multi-select of pins desired to be under PWM control. Options are all available Digital Outputs and Relay pins. |
Complementary PWM
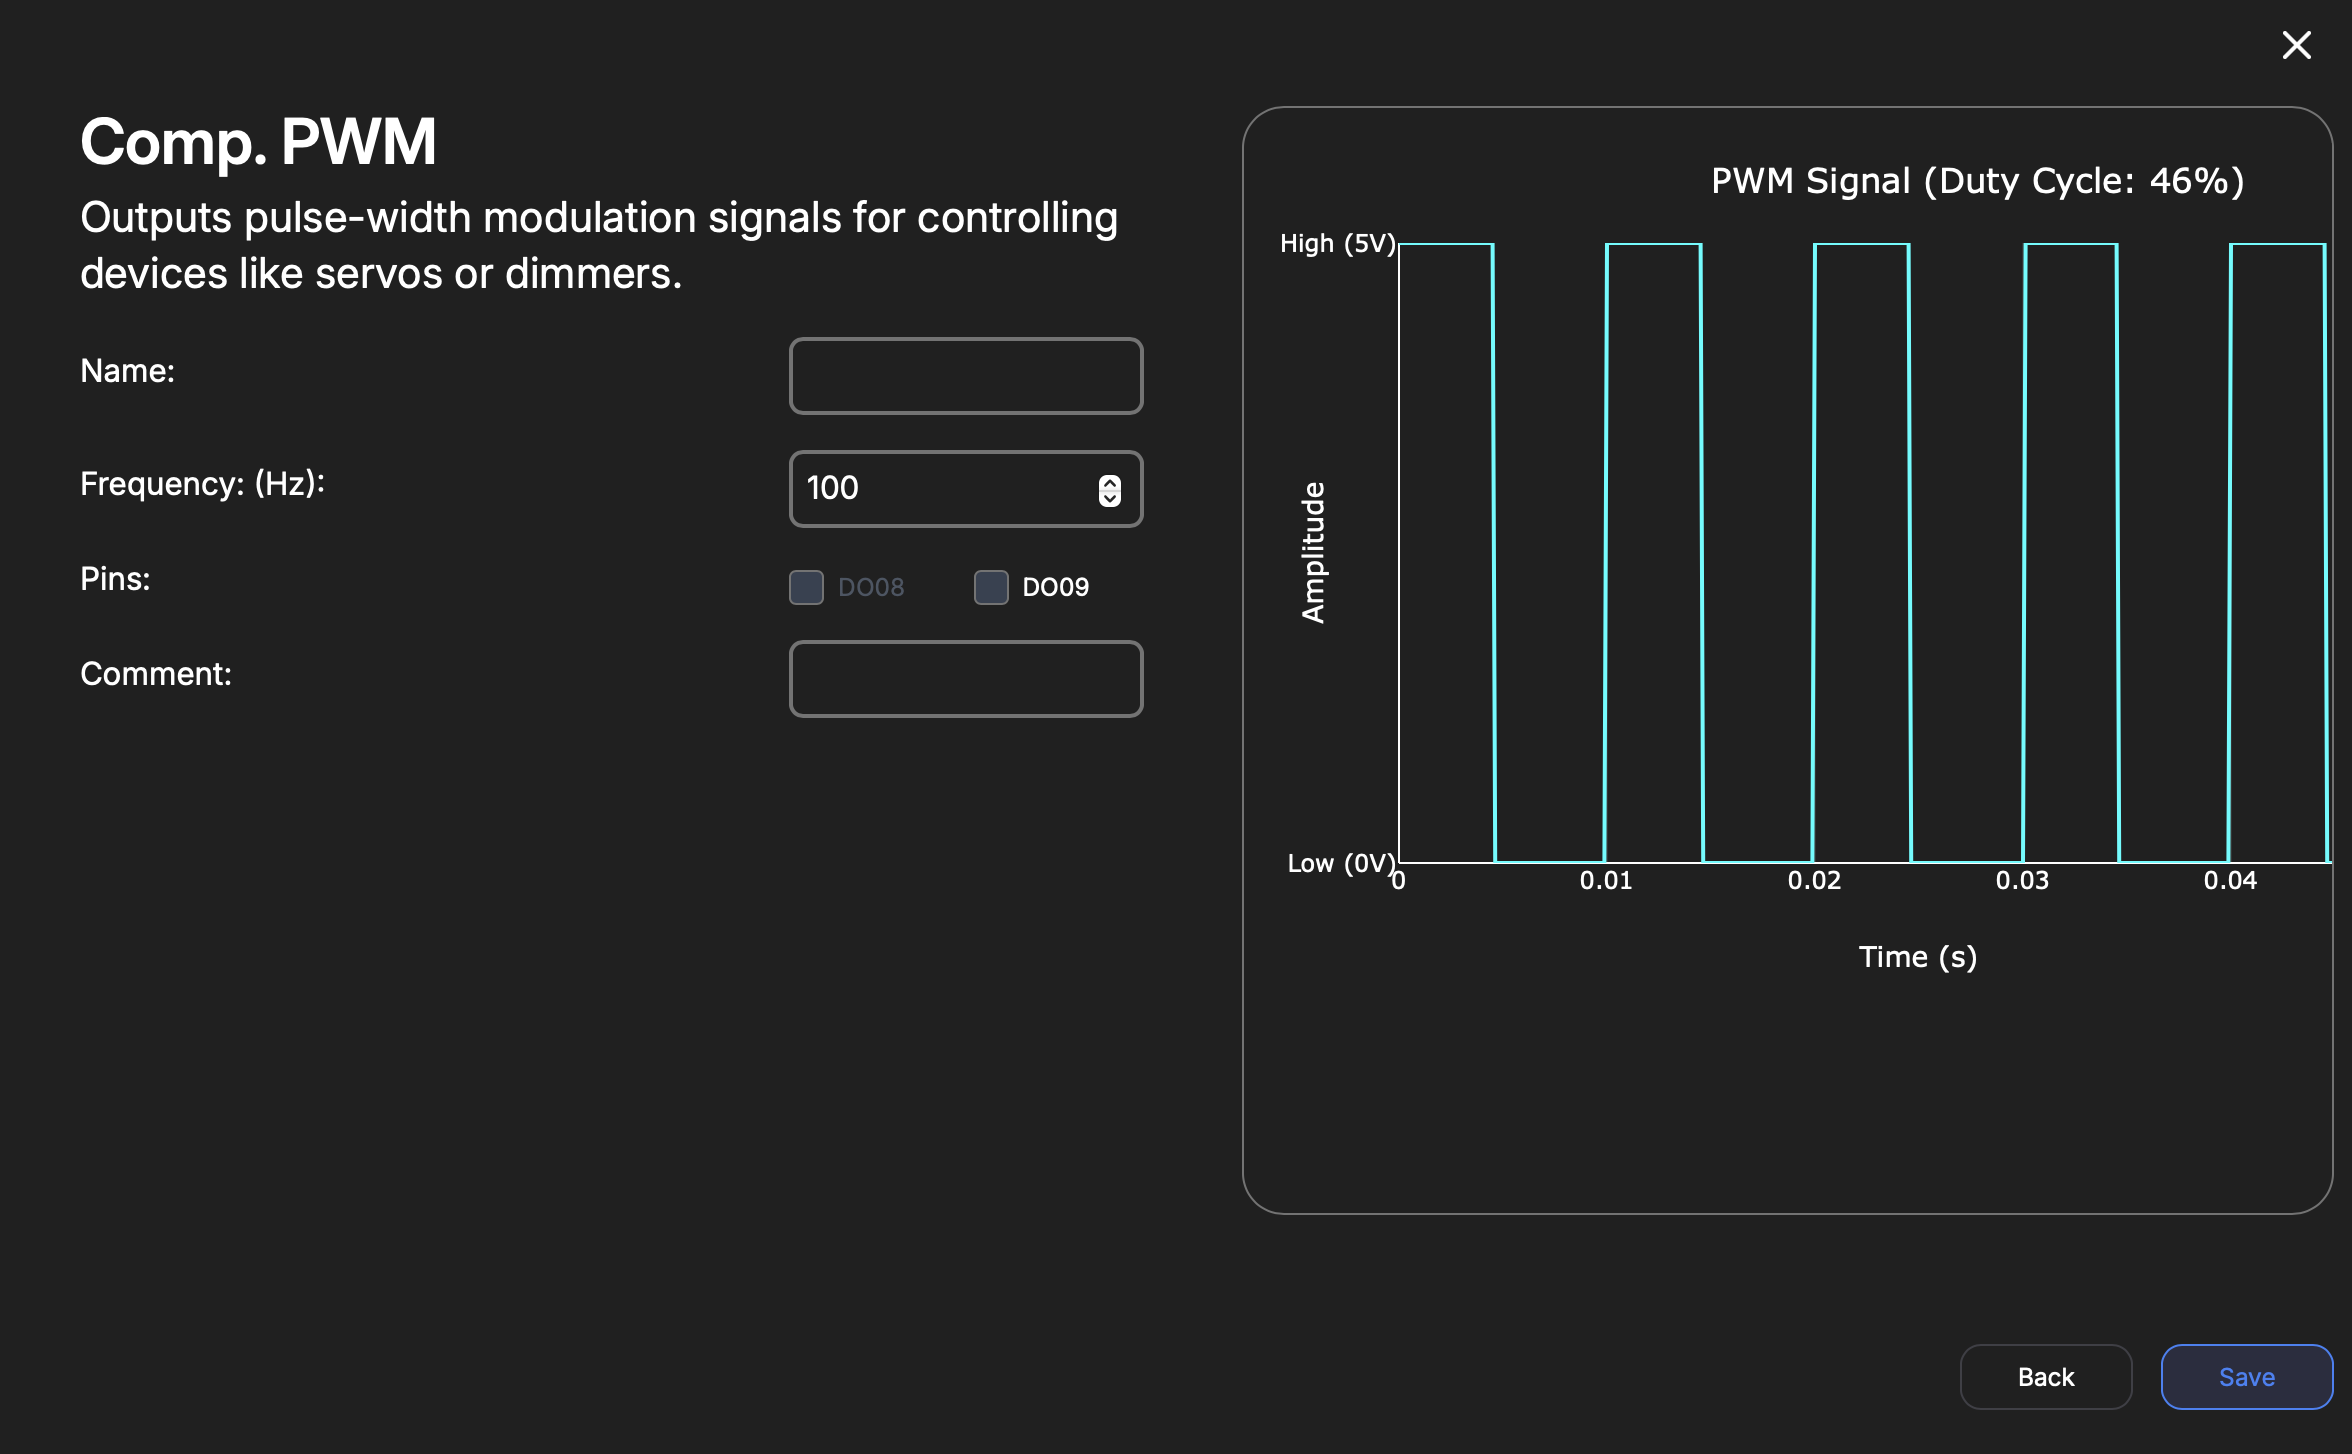
| Key | Type | Description |
|---|---|---|
| Name | String | Internal reference to task. |
| Frequency | Number | Default PWM frequency at boot. |
| Pin | Array(Enum) | Multi-select of pins desired to be under Complementary PWM control. DO08 and DO09 are the available complementary pins. |
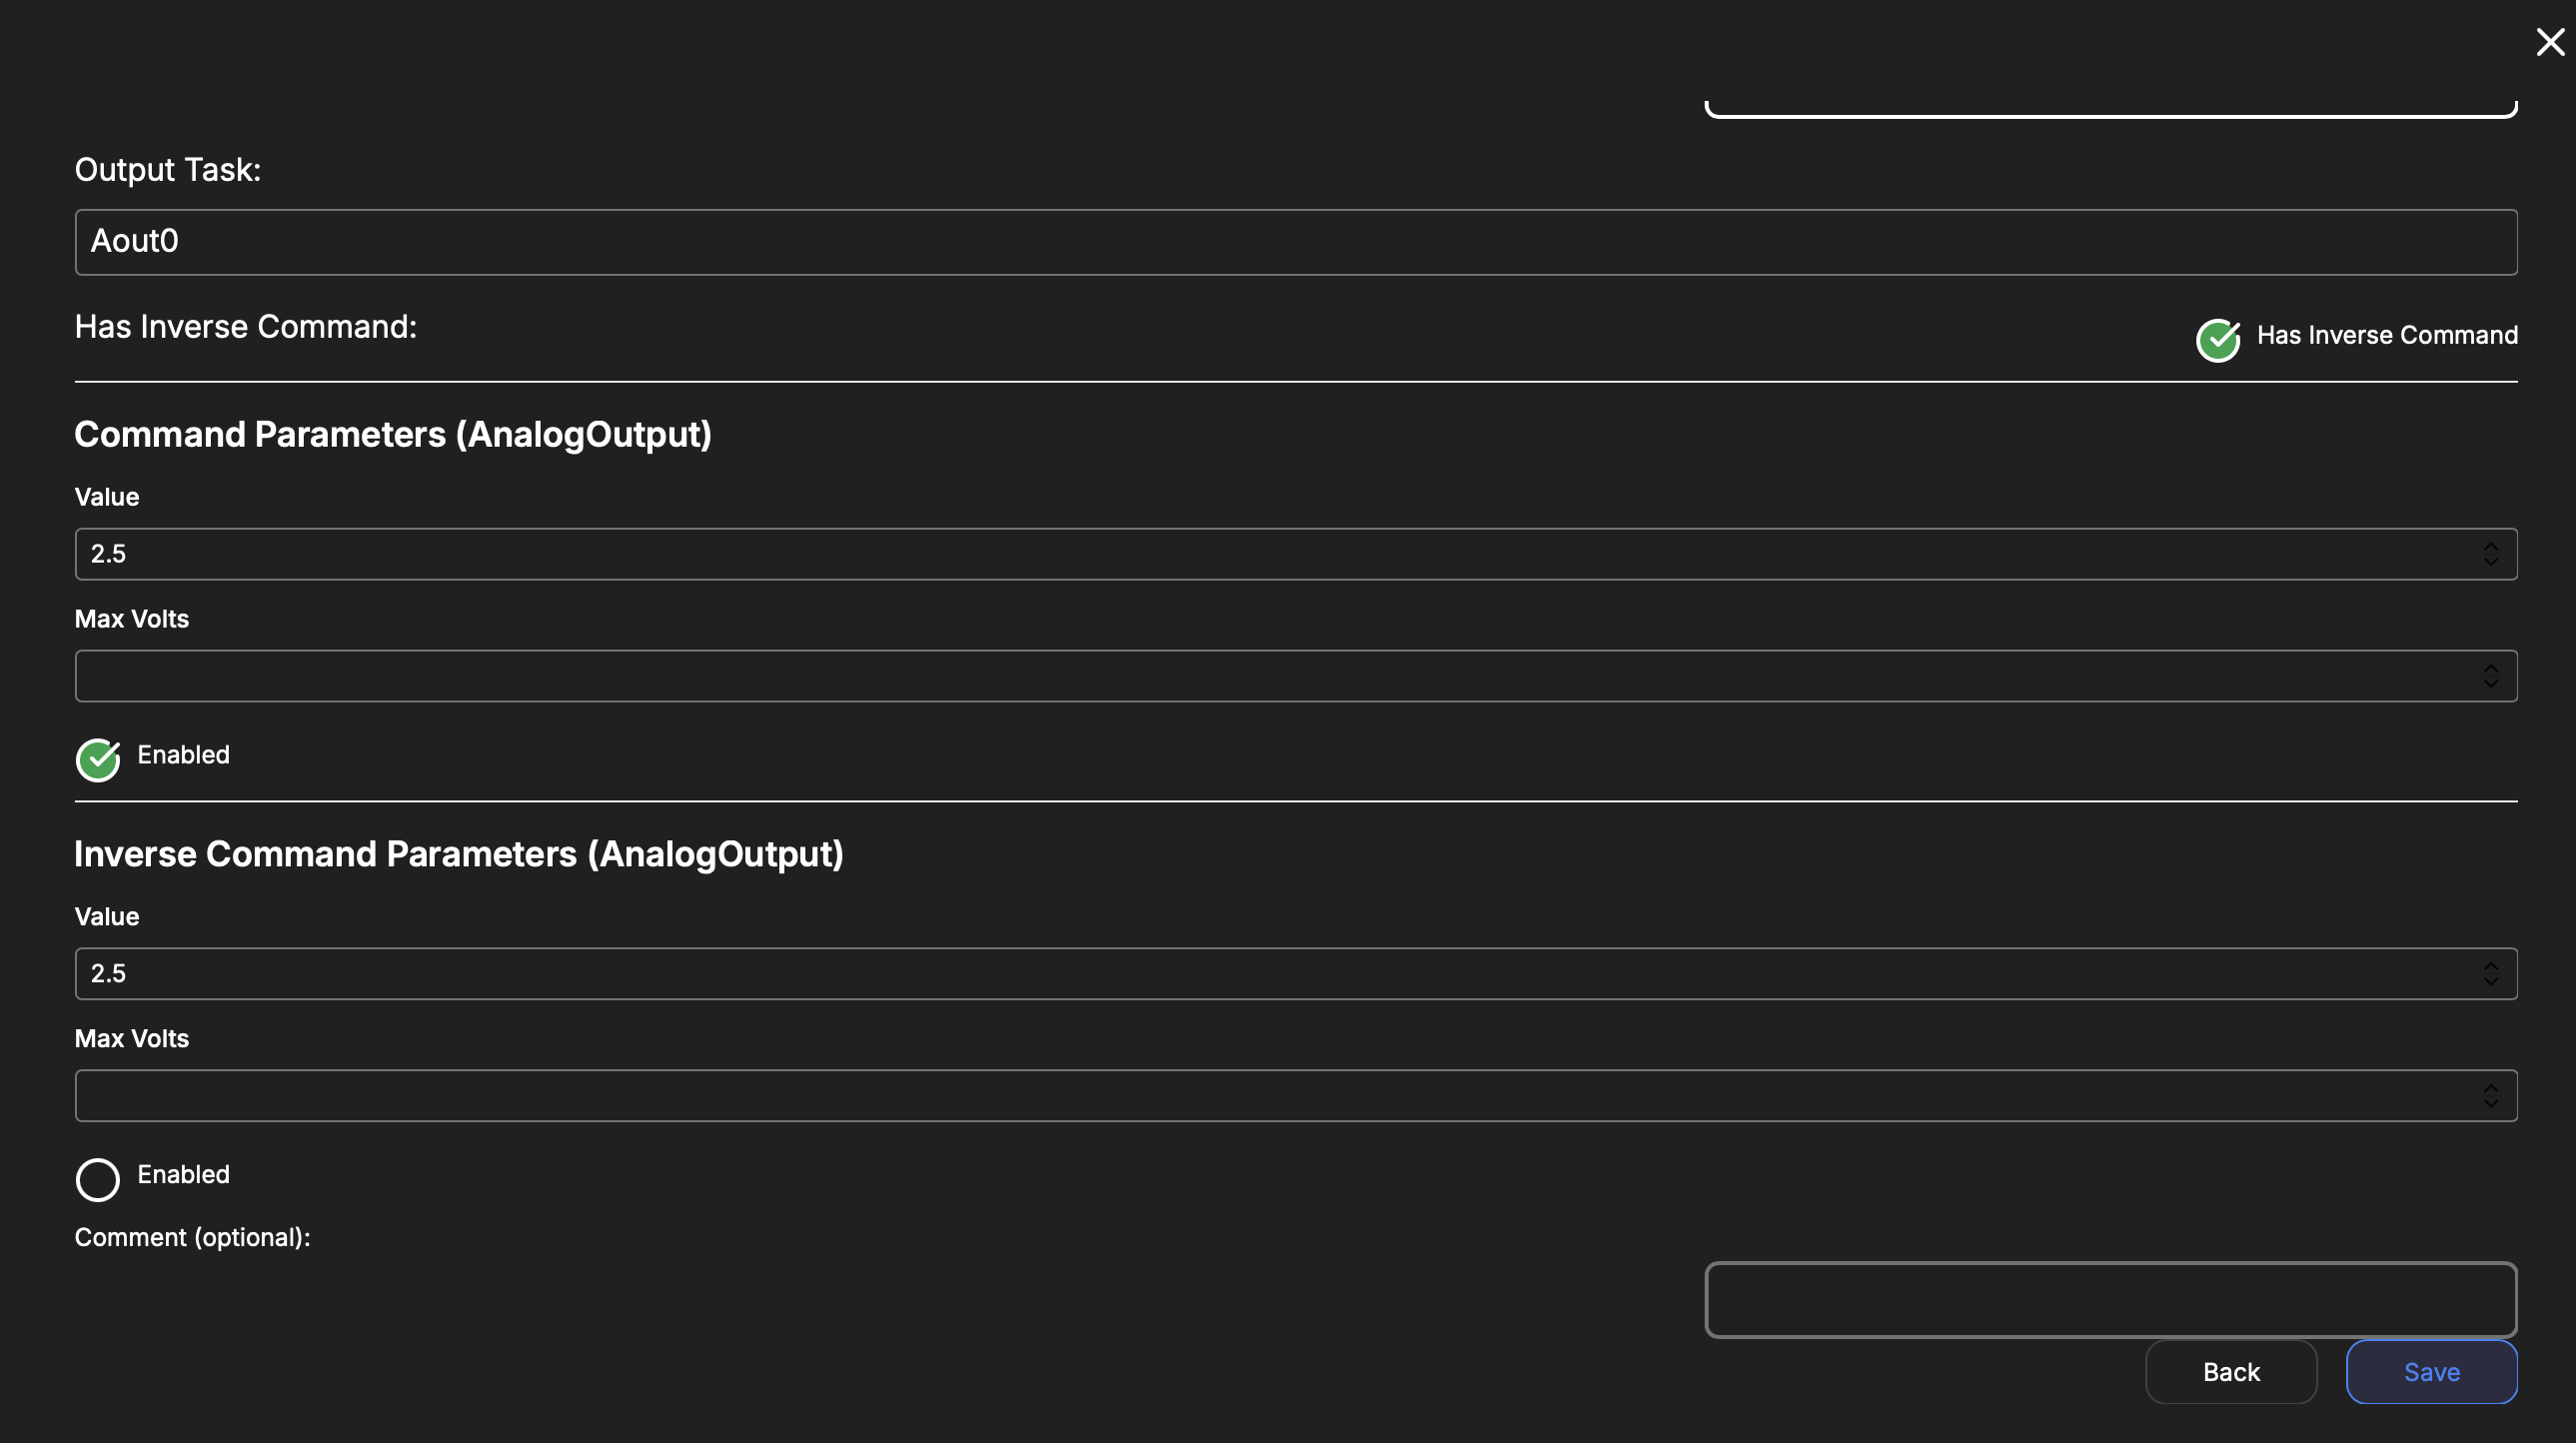
Command
| Key | Type | Description |
|---|---|---|
| Name | String | Internal reference to task. |
| Output Task | String | Selection of a valid (already-defined) services that can receive a command. |
| Has Inverse Command | Boolean | Whether a different command should be sent when false is received by this service. enables Inverse Command Parameters. |
| Command Parameters | Object | Changes depending on Output Tasks. This is the set of parameters you can change in the target service. |
| Inverse Command Parameters | Object | This is the same as Command Parameters but will be sent instead when this service receives a false message. |
Math Channel
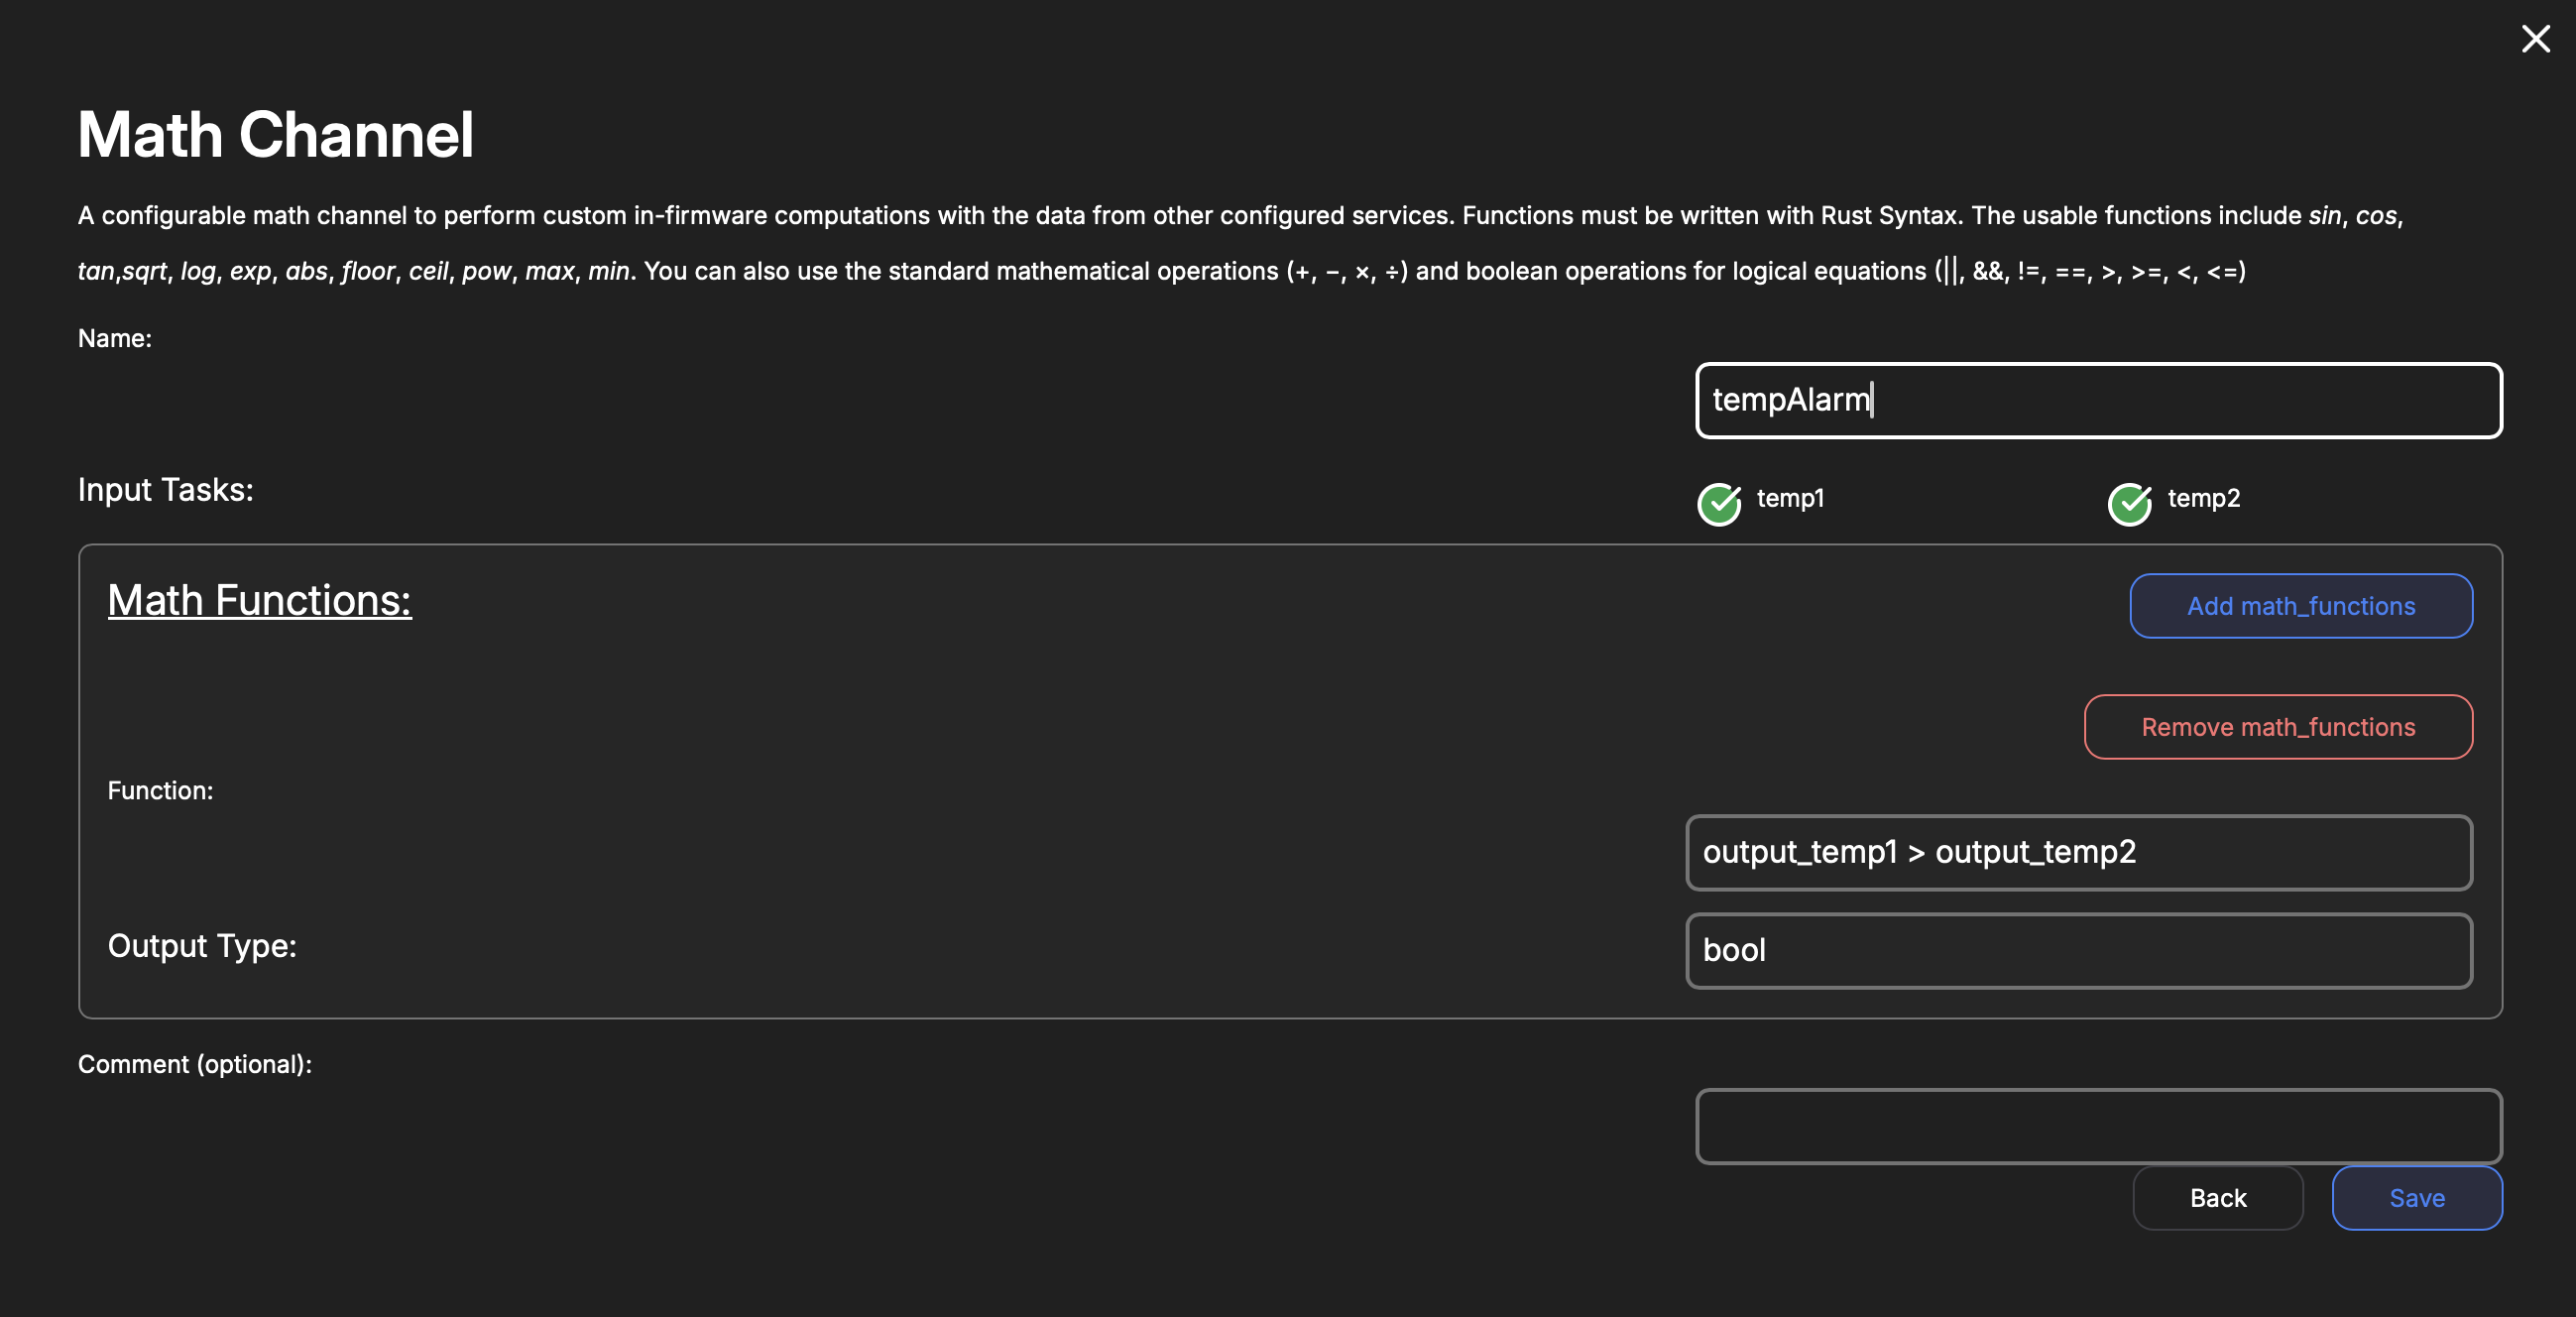
A configurable math channel to perform custom in-firmware computations with the data from other configured services. Functions must be written with Rust Syntax. The usable functions include sin, cos, tan,sqrt, log, exp, abs, floor, ceil, pow, max, min. You can also use the standard mathematical operations (+, −, ×, ÷) and boolean operations for logical equations (||, &&, !=, ==, >, >=, <, <=)
| Key | Type | Description |
|---|---|---|
| Name | String | Internal reference to task. |
| Input Tasks | Array(String) | A list of other defined services that provide a valid numeric input as a variable in the math functions. |
| Math Functions | Array(Object) | Each function contains an expression & an output type. If a logical function is used and results in true or false, choose bool. Otherwise use f32. The selection of input tasks will autofill the appropriate variable name for that input into a new function. You may use multiple input tasks in a single function, just copy the generated variable name into where it should be used. |
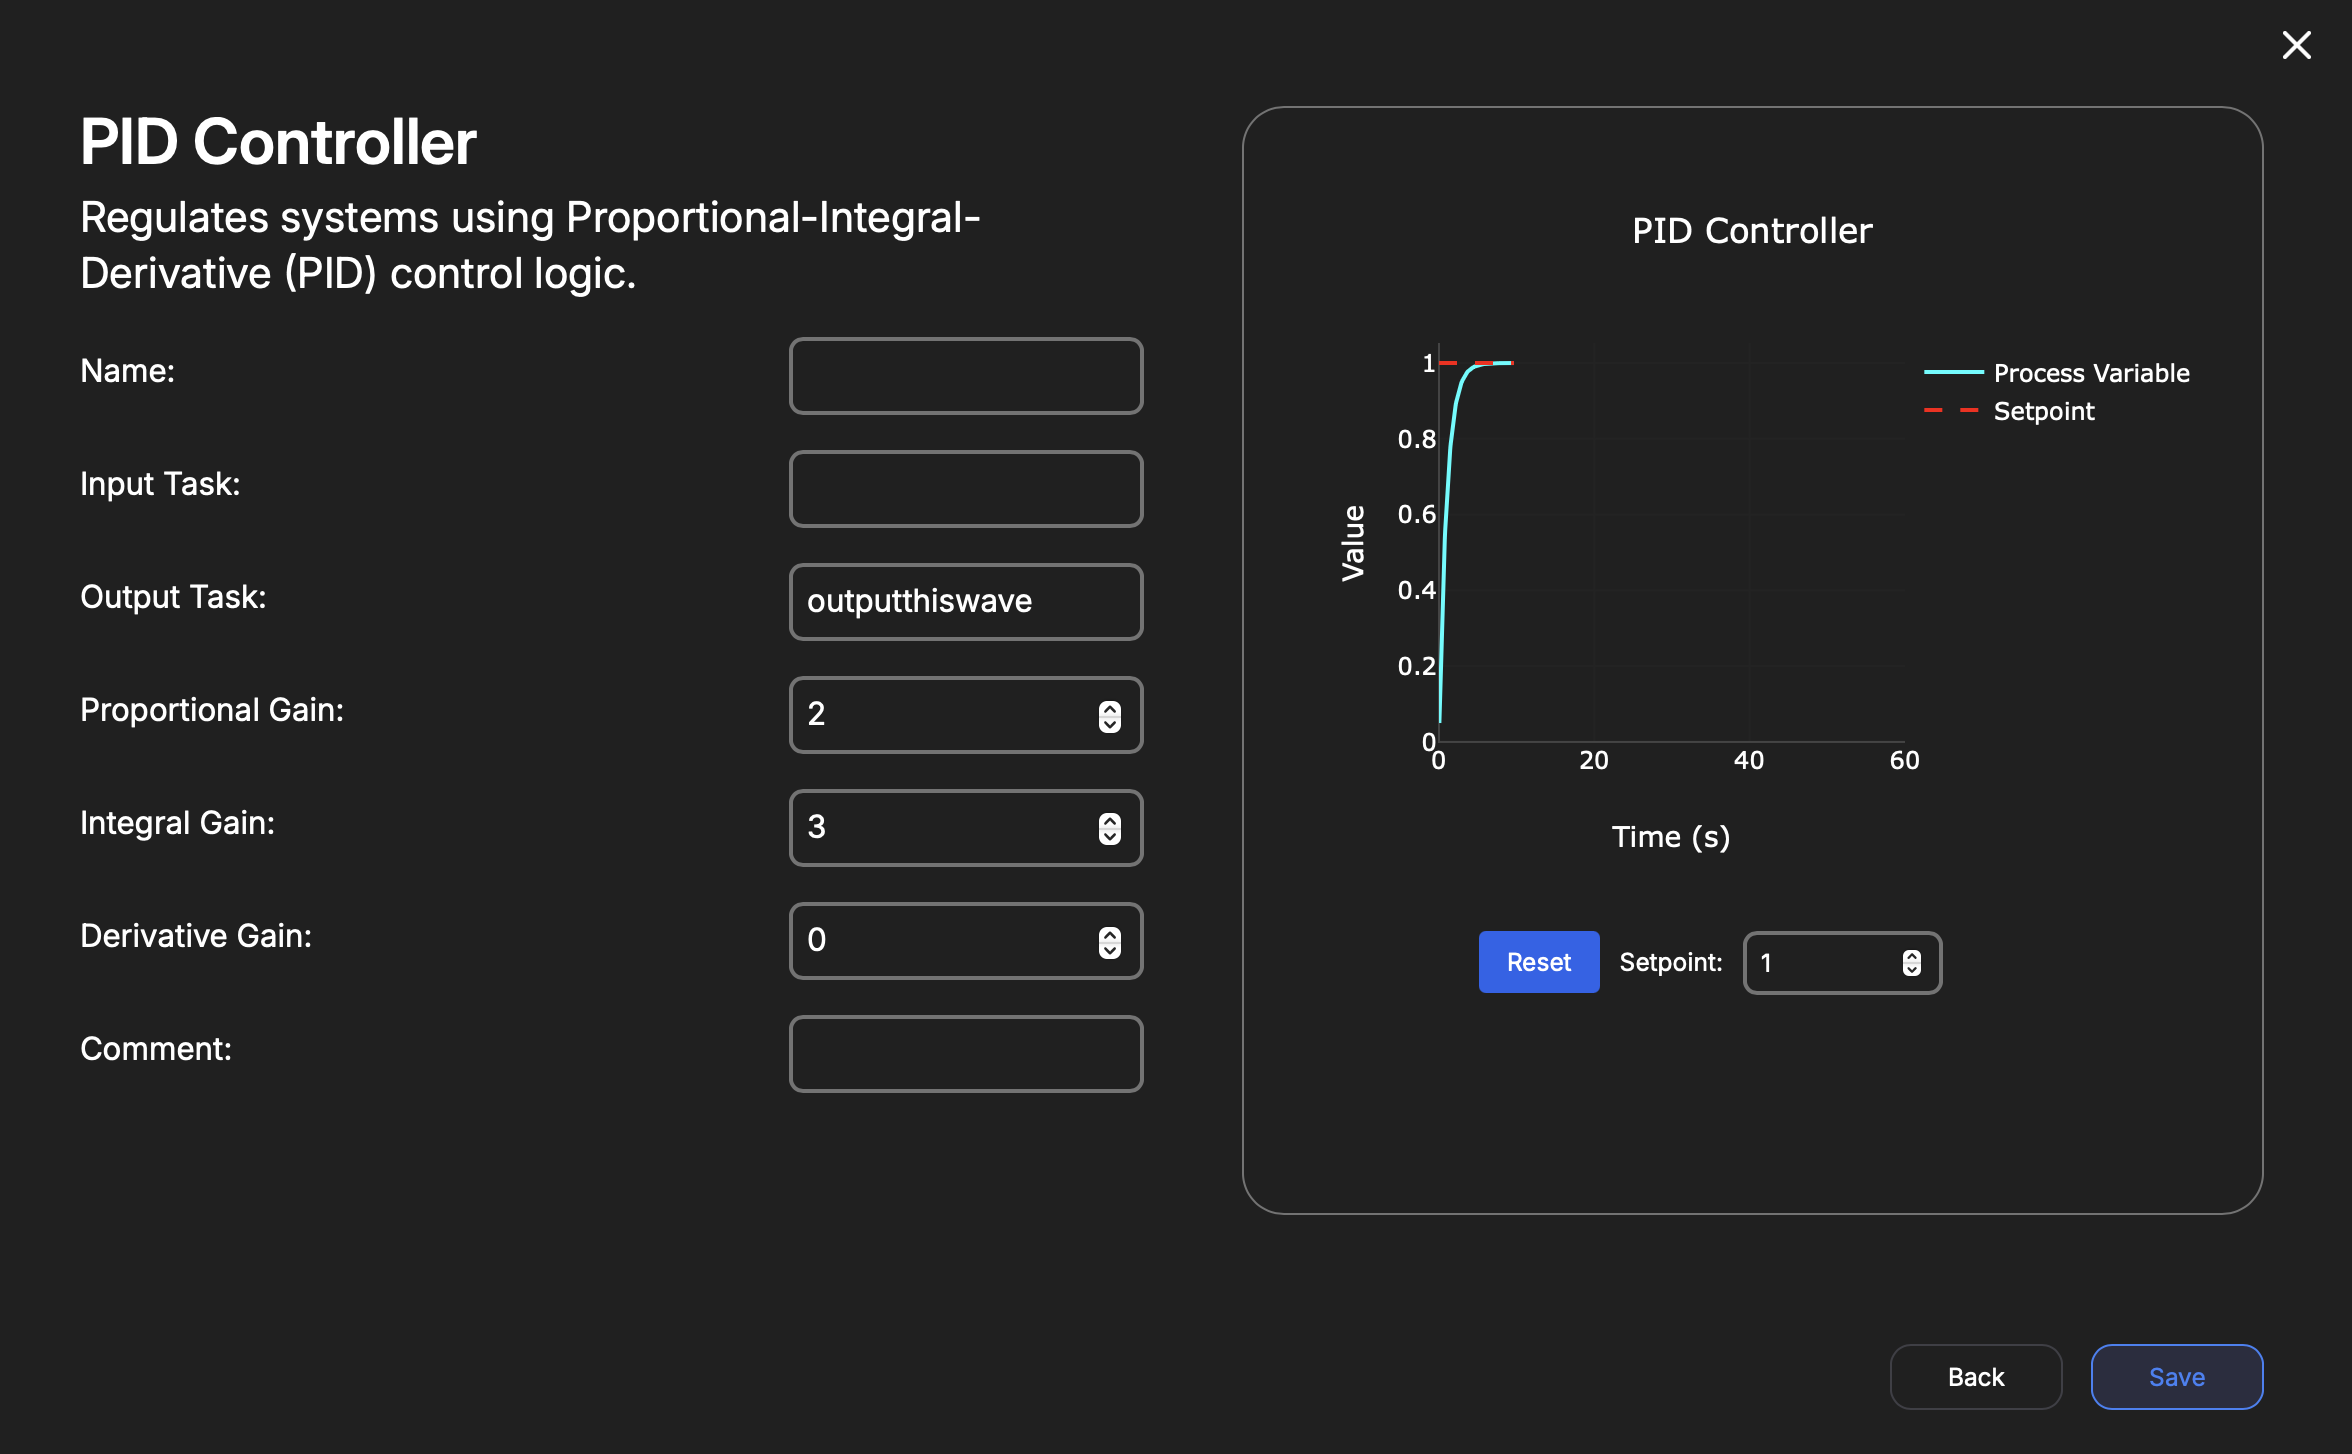
PID Controller
| Key | Type | Description |
|---|---|---|
| Name | String | Internal reference to task. |
| Input Task | String | The Name of an already defined task that is capable of acting as a PID input. These are Analog-Inputs and Thermocouples for now. |
| Output Task | String | The Name of an already defined task that is capable of acting as a PID control output. This includes PWM channels and Analog-Outputs. |
| Proportional Gain | Number | Default PID Kp at boot. |
| Integral Gain | Number | Default PID Ki at boot. |
| Derivative Gain | Number | Default PID Kd at boot. |
Bang-Bang Controller
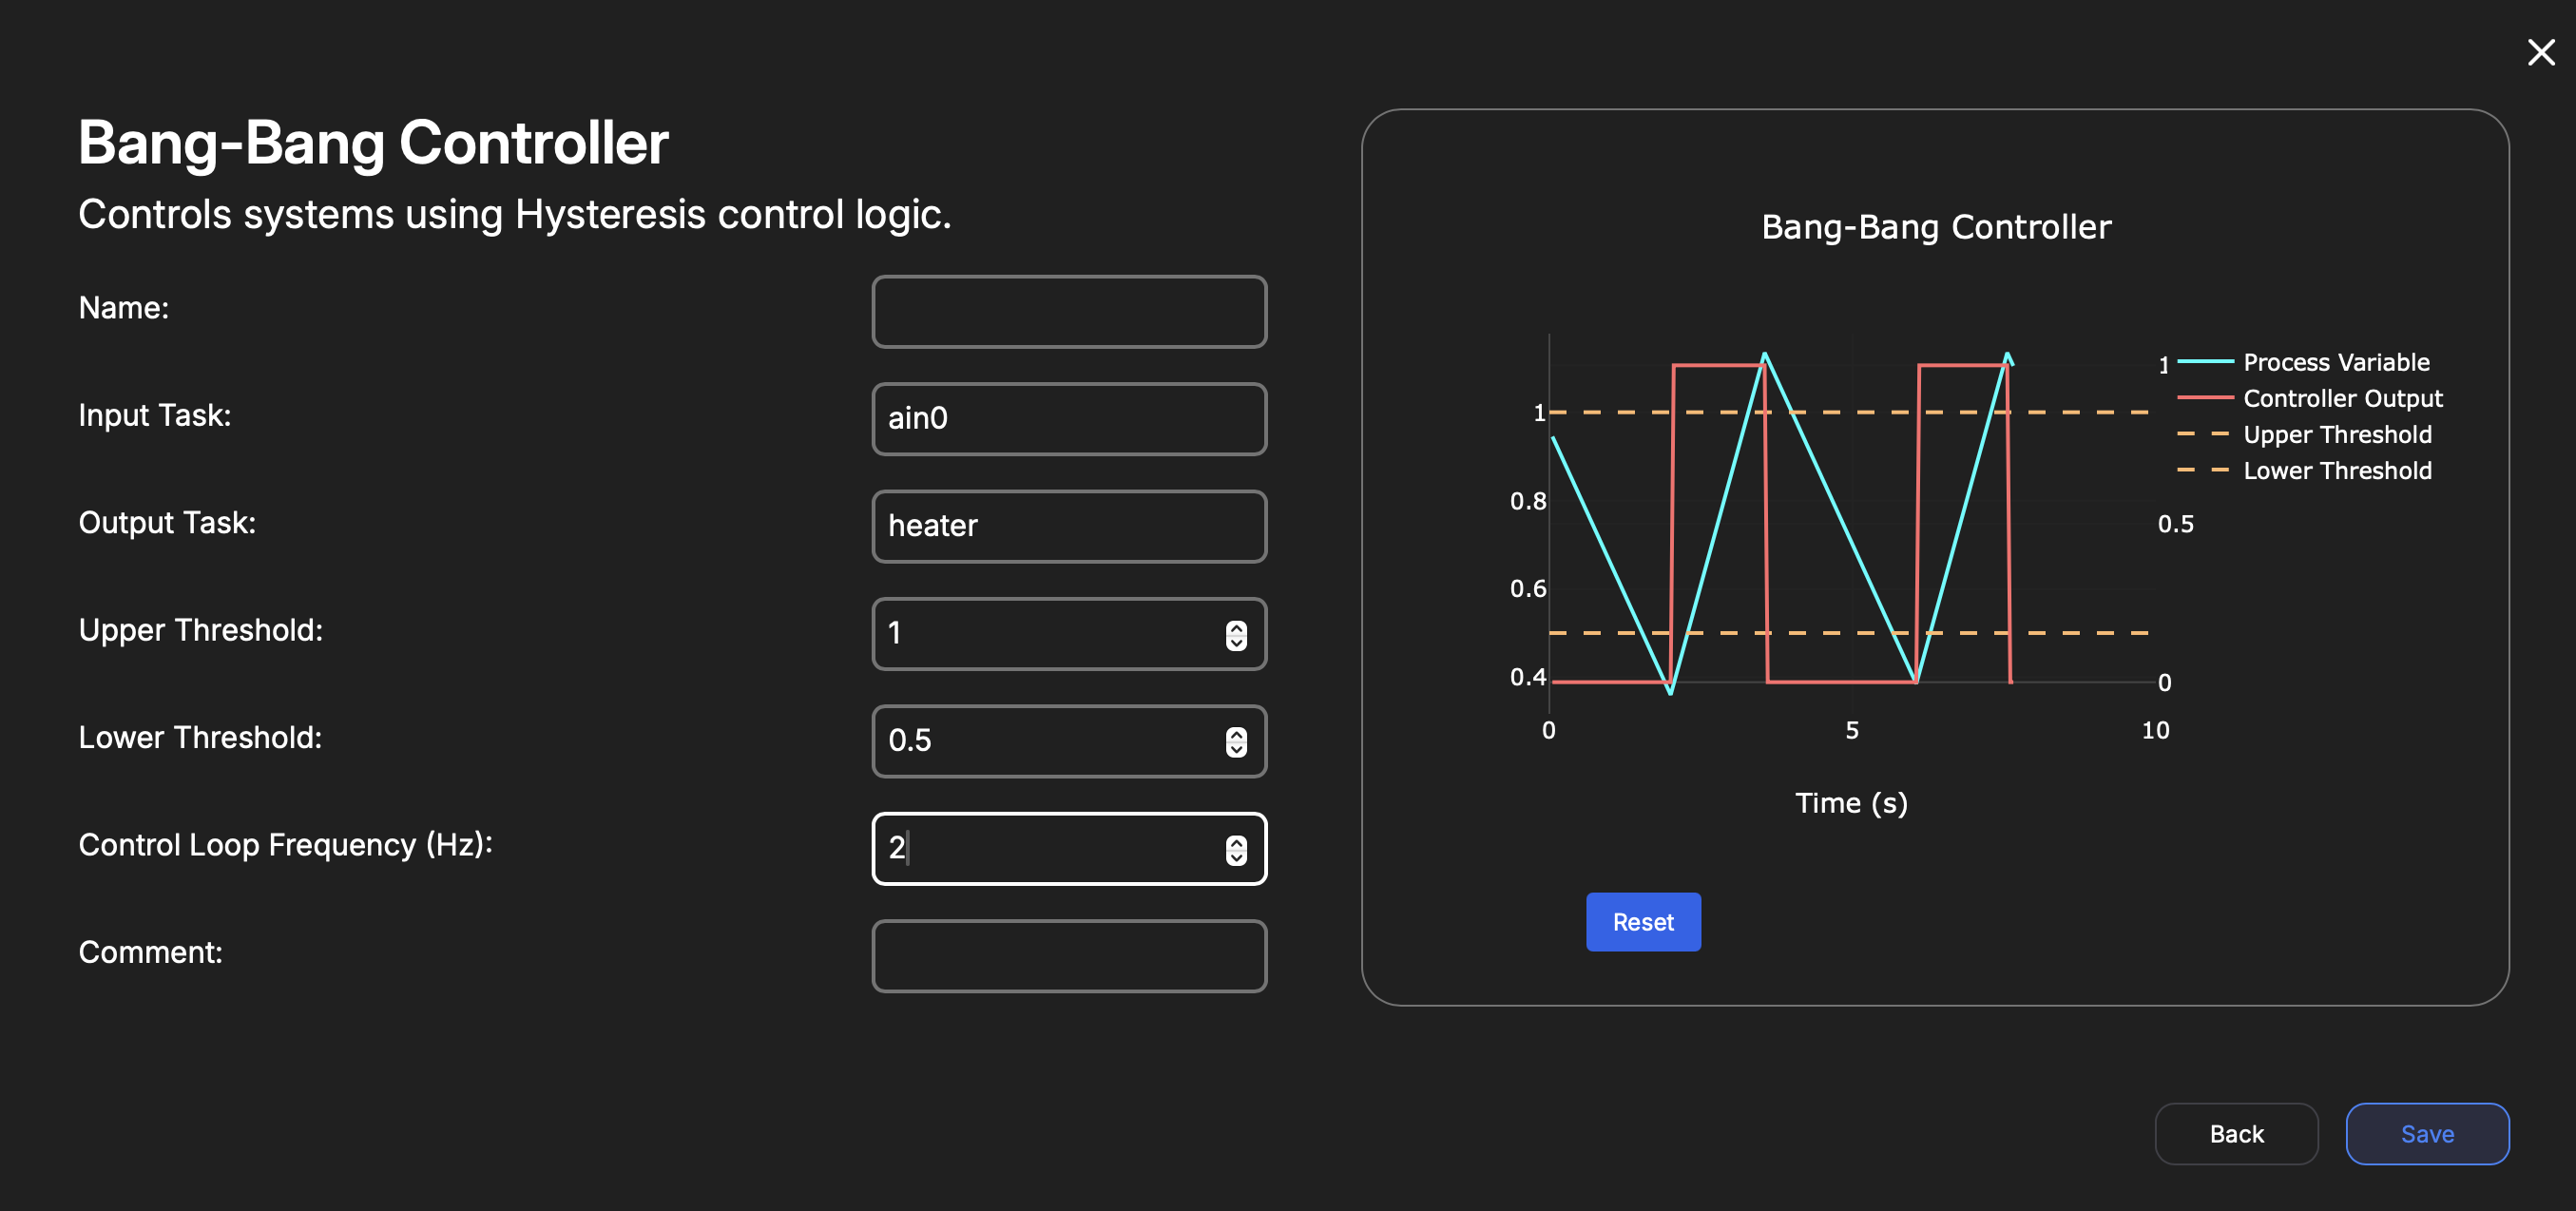
| Key | Type | Description |
|---|---|---|
| Name | String | Internal reference to task. |
| Input Task | Enum | Data to use as feedback for the controller. Can come from Analog Input, Thermocouple, ADS7953. |
| Output Task | Enum | Output the controller will modulate. Can choose a Digital Output or PDU channel. |
| Upper Threshold | Number | Upper hysteresis limit for the controller. |
| Lower Threshold | Number | Lower hysteresis limit for the controller. |
| Control Loop Frequency | Number | The rate at which the controller will update the state of the output. If the Input Task updates faster than this rate, the input values will be averaged. |
Stepper Motor
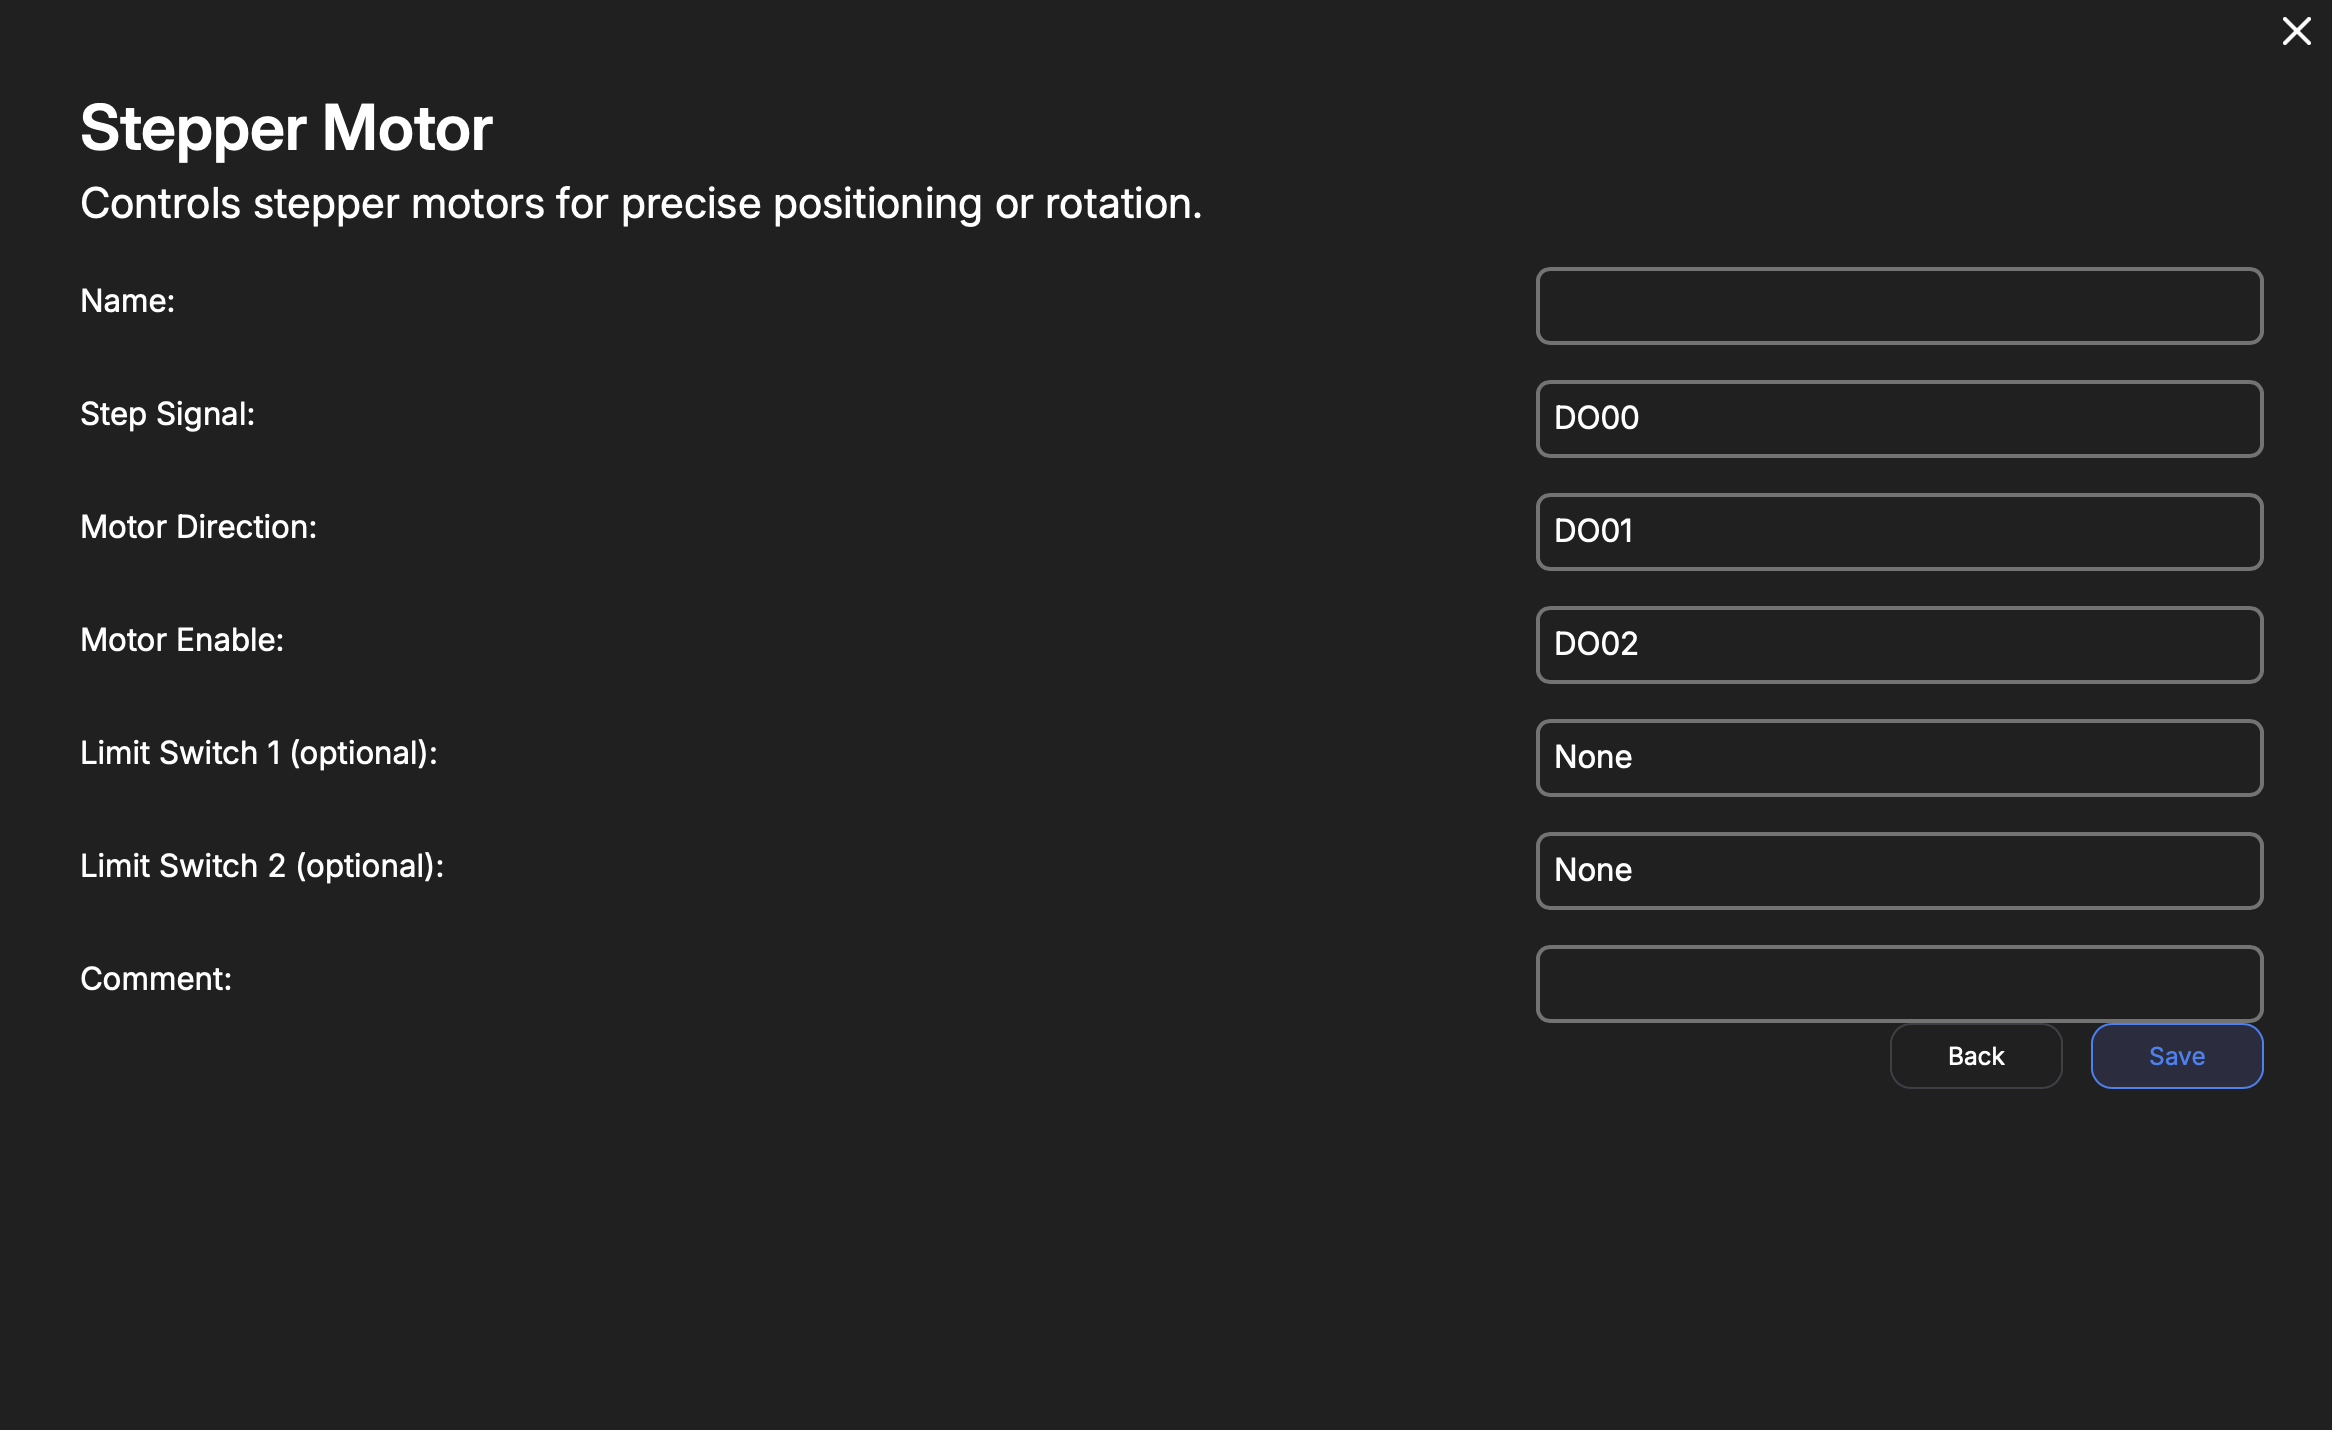
| Key | Type | Description |
|---|---|---|
| Name | String | Internal reference to task. |
| Step Signal | Enum | Output pin for the stepper-motor 'pulse' or step. |
| Motor Direction | Enum | Output pin for the stepper-motor direction signal |
| Motor Enable | Number | Output pin for stepper-motor enable. This powers the motor phases. |
| Limit Switch 1 | Enum or Null | Digital input for wiring an optional limit switch that will interrupt a move command. |
| Limit Switch 2 | Enum or Null | Digital input for wiring an optional limit switch that will interrupt a move command. |
Actuator
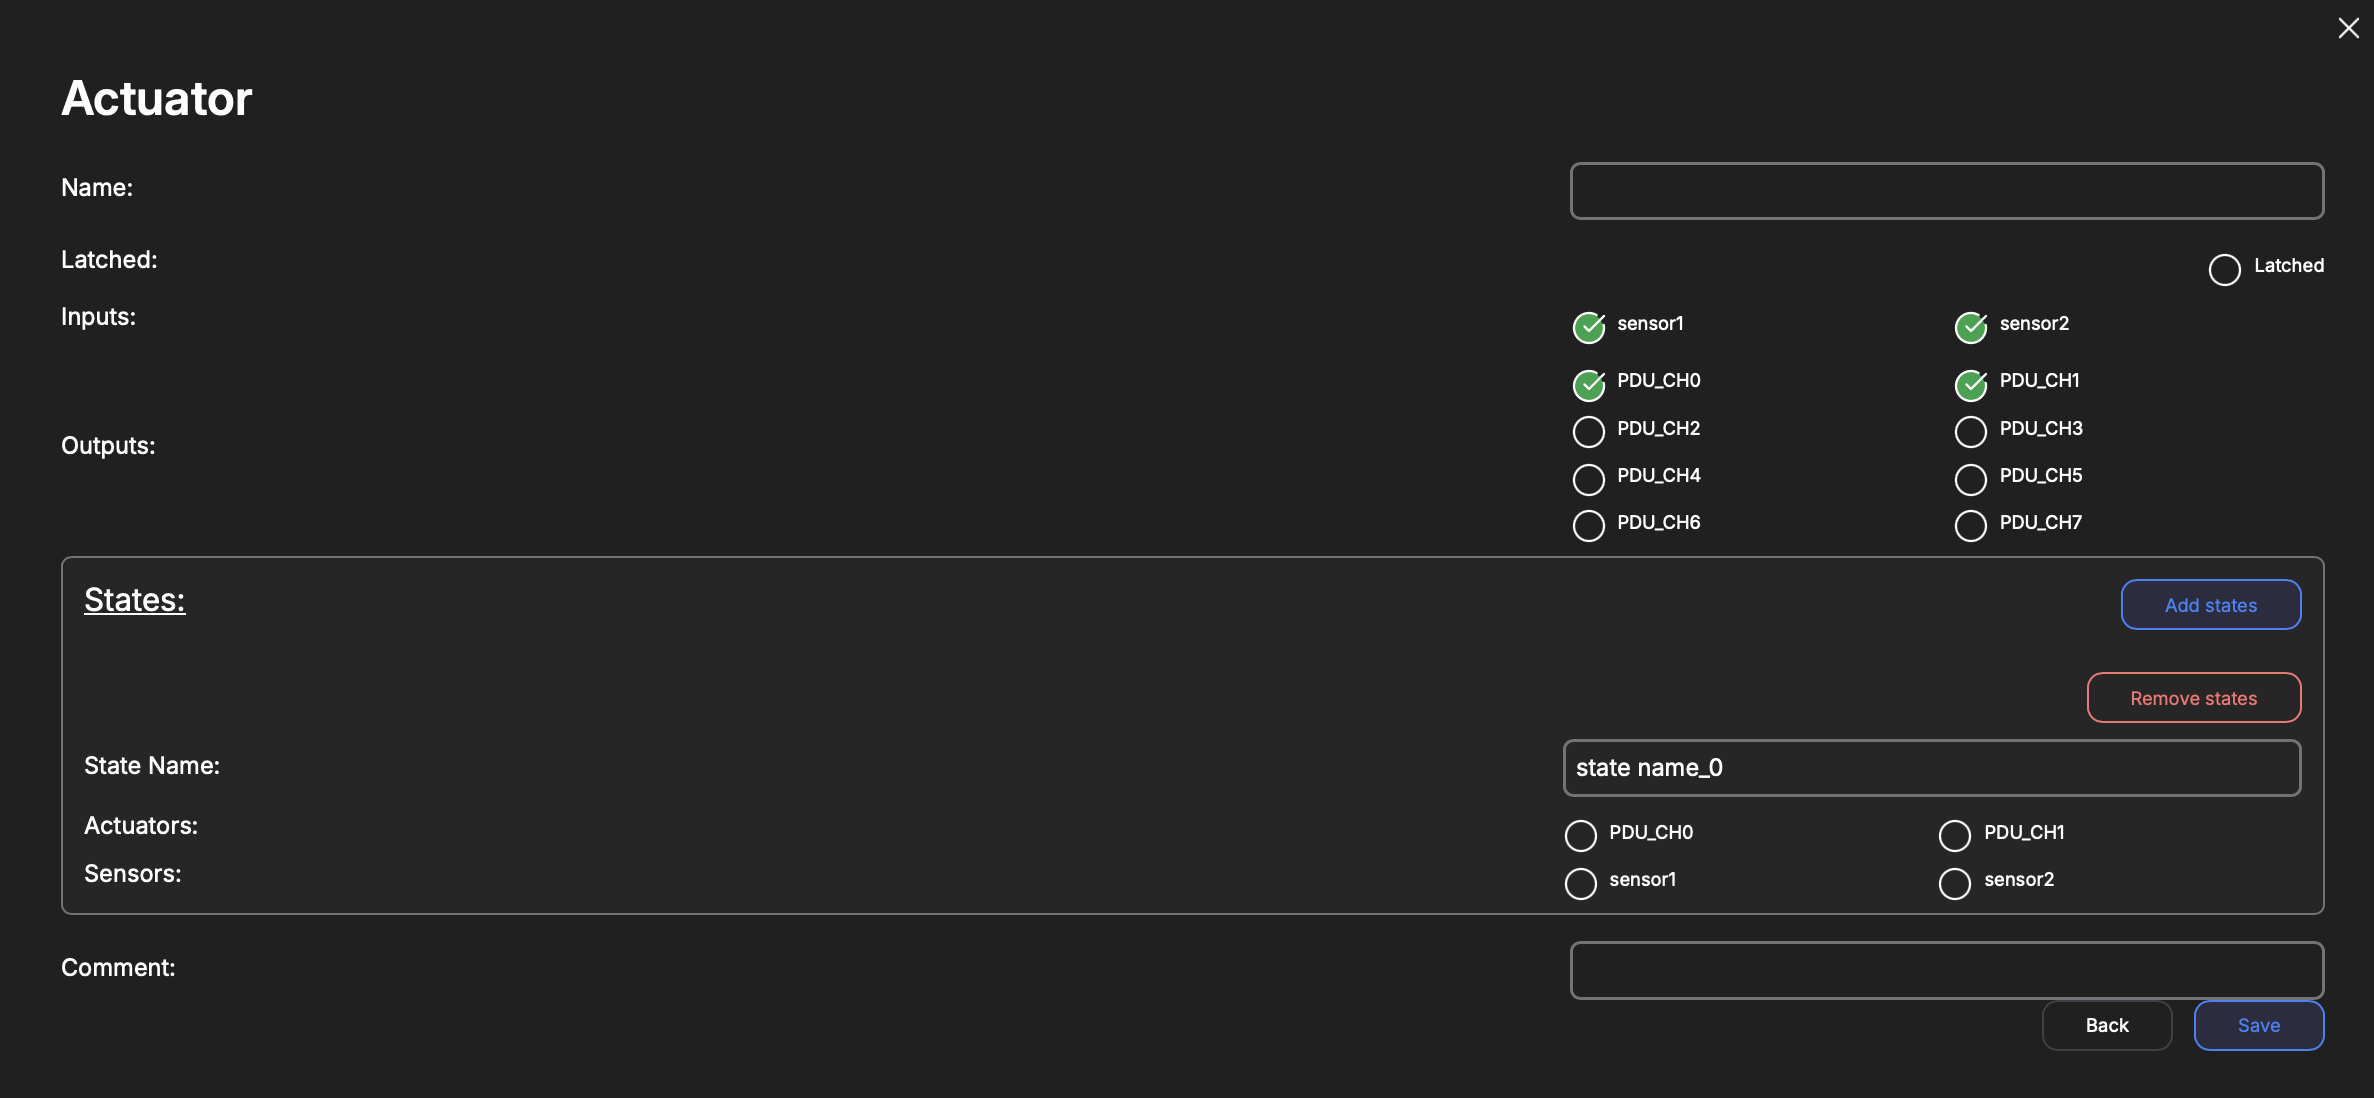
This is a more naive implementation of
Stateful Actuator. There is no enforcement of how the actuator enters or exits a state. This is really meant as a tool to automate a group of inputs and outputs with very simple states (on/off) and that do not require the traversal of multiple states to execute an action. If this is needed, useStateful Actuator.
| Key | Type | Description |
|---|---|---|
| Name | String | Internal reference to task. |
| Latched | Boolean | Whether this actuator latches the outputs upon executing a command. |
| Inputs | Array | A multi-select of already-configured (compatible) inputs to the Stateful Actuator Service. In this case, we have two Digital-Input services that are used. Analog-Input may be used as well. |
| Outputs | Array | A multi-select of already-configured (compatible) outputs for the Stateful Actuator Service. In this case, we have a PDU service defined. One may use Digital-Outputs too. |
| States | Array | User-defined names attached to certain combinations of the chosen Inputs' logic-levels and chosen Outputs commands that ought to result in this state's Inputs levels. |
Actuator States
| Key | Type | Description |
|---|---|---|
| Name | String | User defined name attached to the specific state of the inputs. |
| Actuators | Array of Booleans | The logic-levels that the service will command to each configured output to cause this transition. |
| Sensors | Array of Booleans | The state of the Inputs that are associated with this State name. |
Stateful Actuator
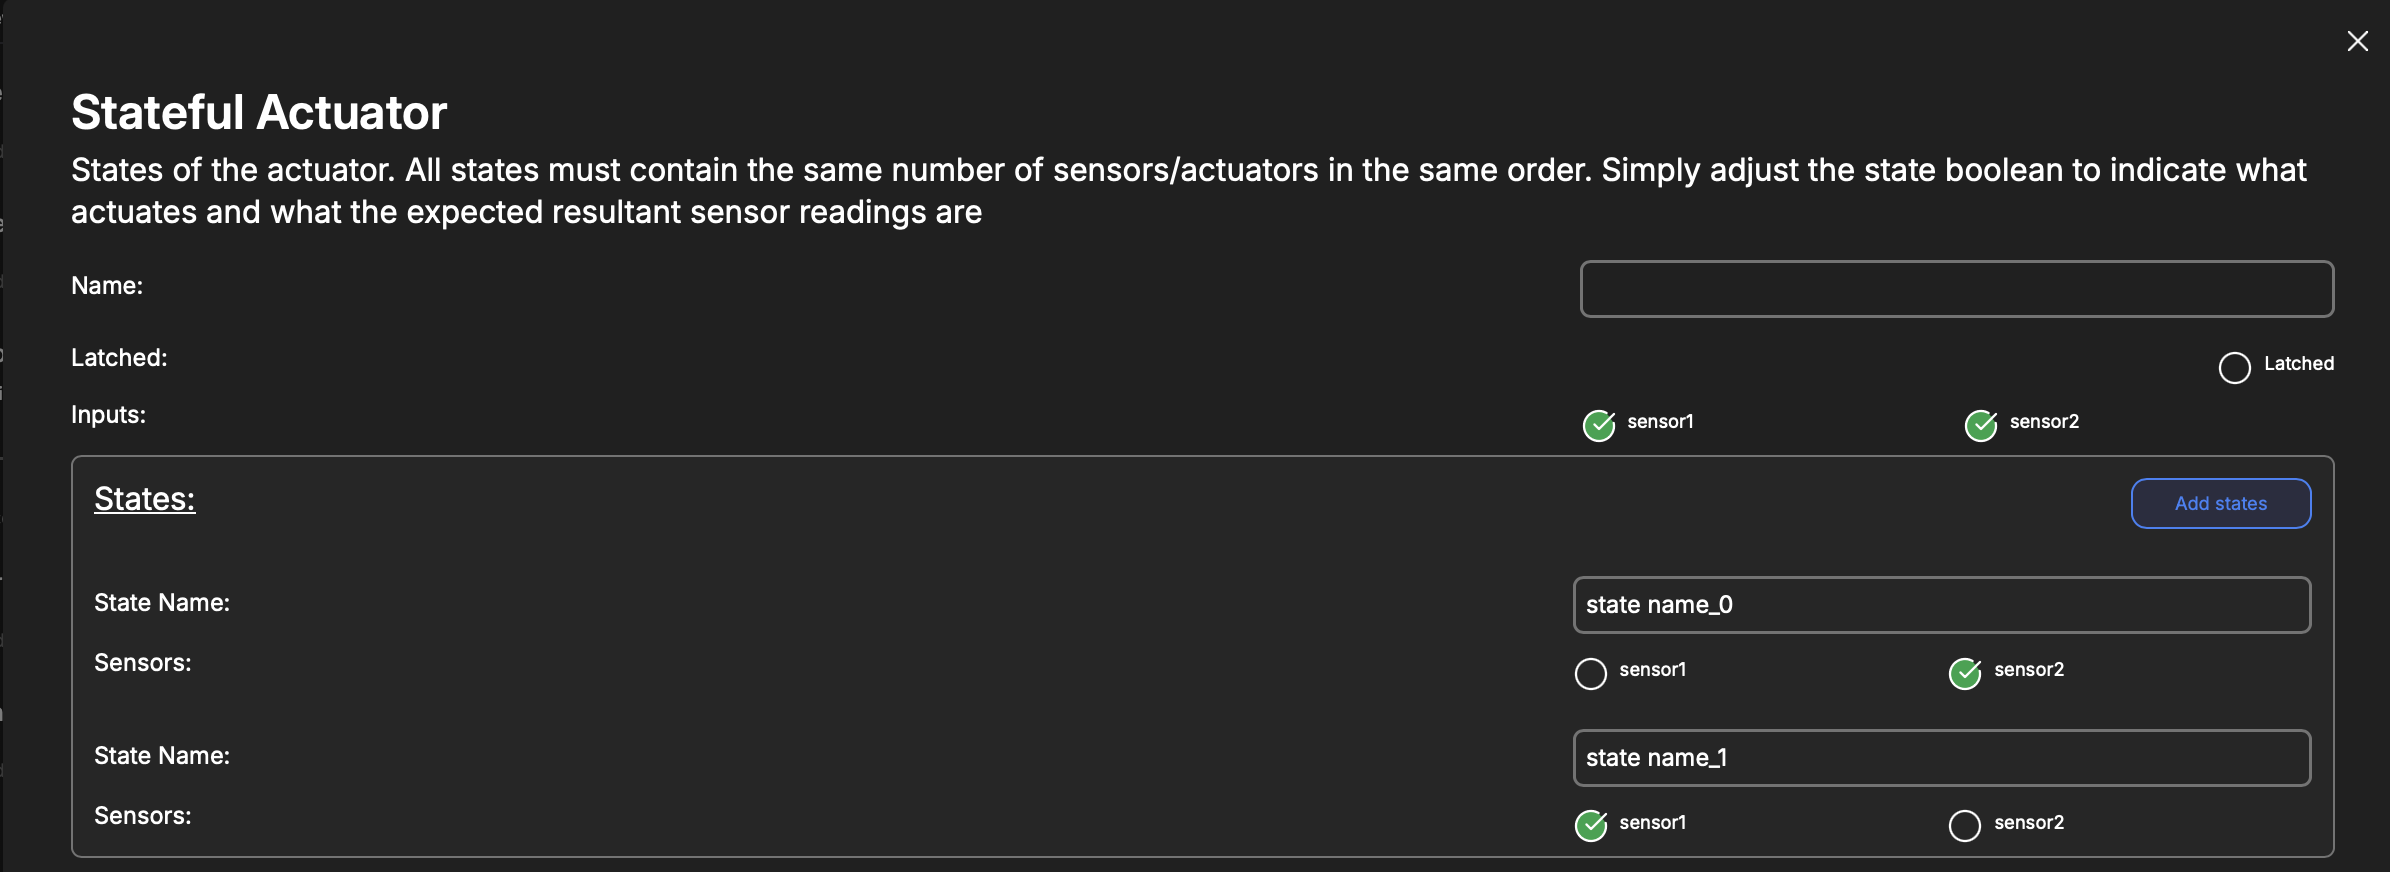
| Key | Type | Description |
|---|---|---|
| Name | String | Internal reference to task. |
| Latched | Boolean | Whether this actuator latches the outputs upon executing a command. |
| Inputs | Array | A multi-select of already-configured (compatible) inputs to the Stateful Actuator Service. In this case, we have two Digital-Input services that are used. Analog-Input may be used as well. |
| States | Array | User-defined names attached to certain combinations of the chosen Inputs' logic-levels. |
| Outputs | Array | A multi-select of already-configured (compatible) outputs for the Stateful Actuator Service. In this case, we have a PDU service defined. One may use Digital-Outputs too. |
| Transitions | Array | User-defined state transitions. |
| Sequences | Optional Array | User-defined automation sequences with configured in-firmware triggers. Convenience method. |
States
It is recommended that the configured states cover all possible combinations of states of the chosen inputs.
| Key | Type | Description |
|---|---|---|
| Name | String | User defined name attached to the specific state of the inputs. |
| Sensors | Array of Booleans | The state of the Inputs that are associated with the given name. |
Transitions
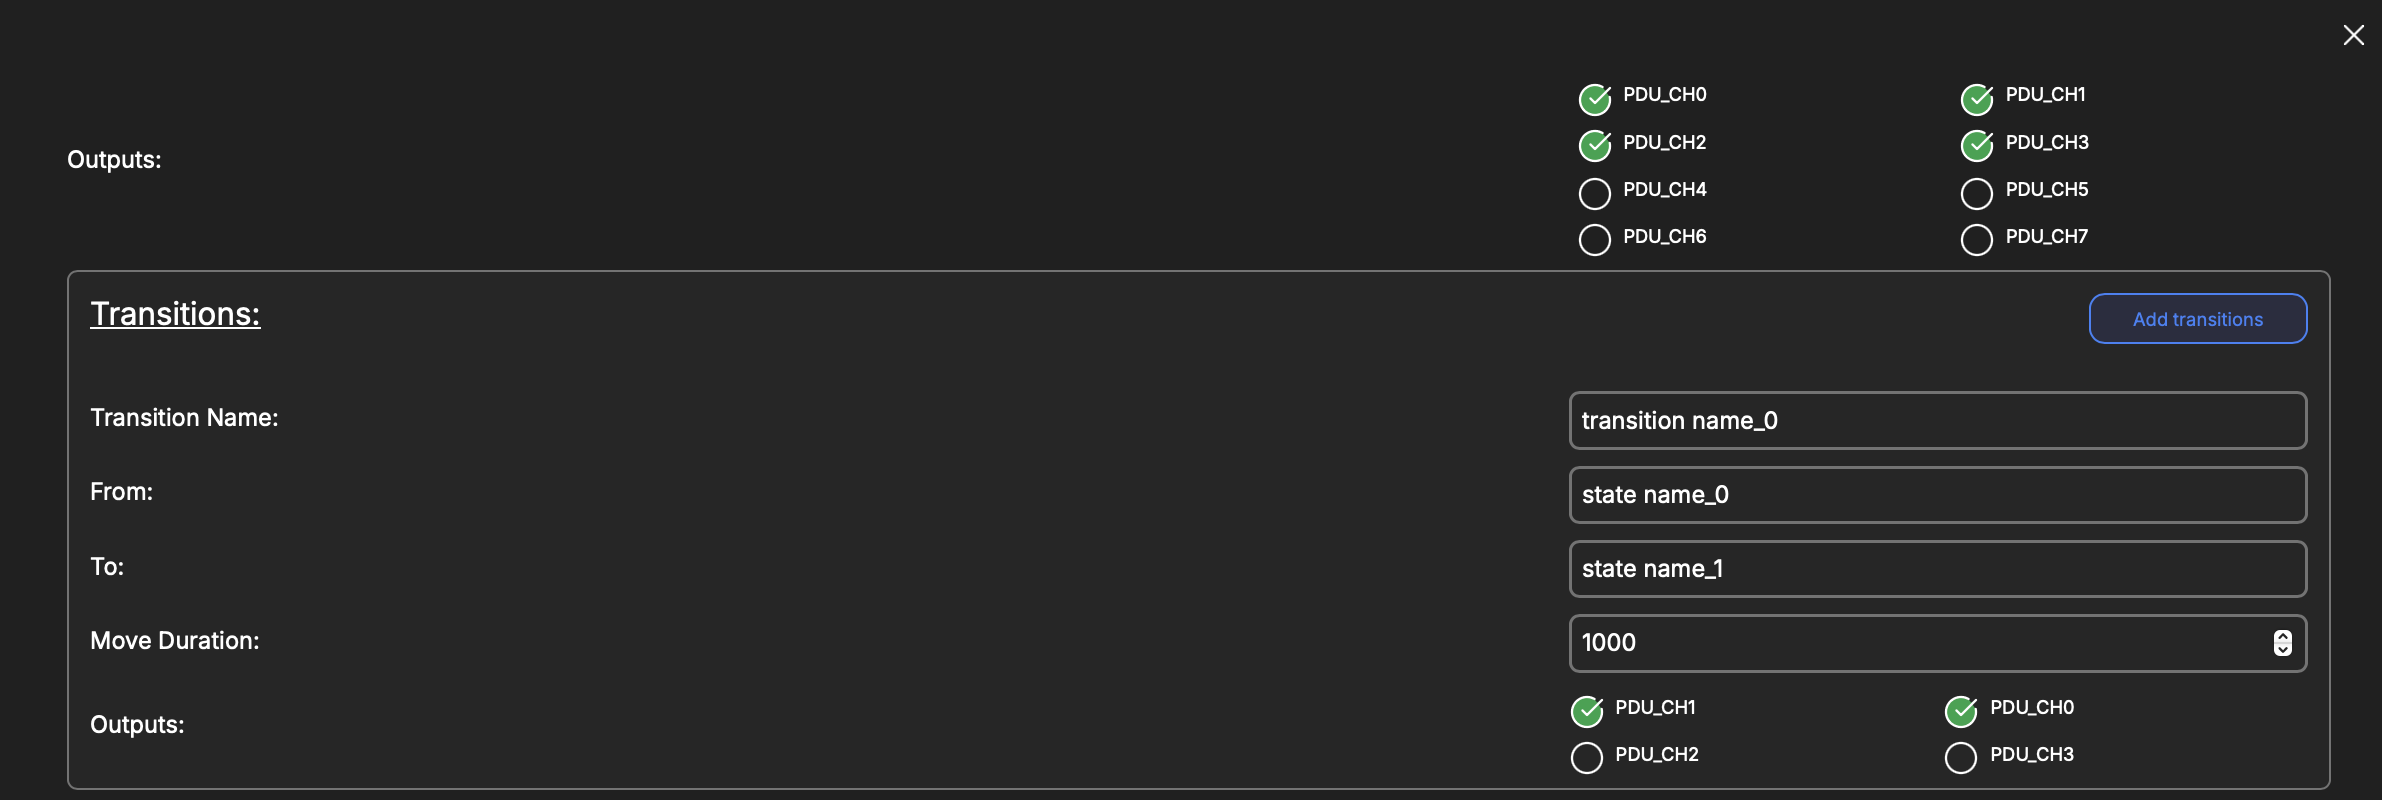
| Key | Type | Description |
|---|---|---|
| Name | String | User defined name attached to the specific state of the inputs. |
| From | Enum | Chose a defined State from which this transition may be triggered. |
| To | Enum | Chose a defined State to which this transition is expected to result in. |
| Move Duration | Int | Duration in milliseconds that may elapse before this transition times out. |
| Outputs | Array of Booleans | The logic-levels that the service will command to each configured output to cause this transition. |
Sequences
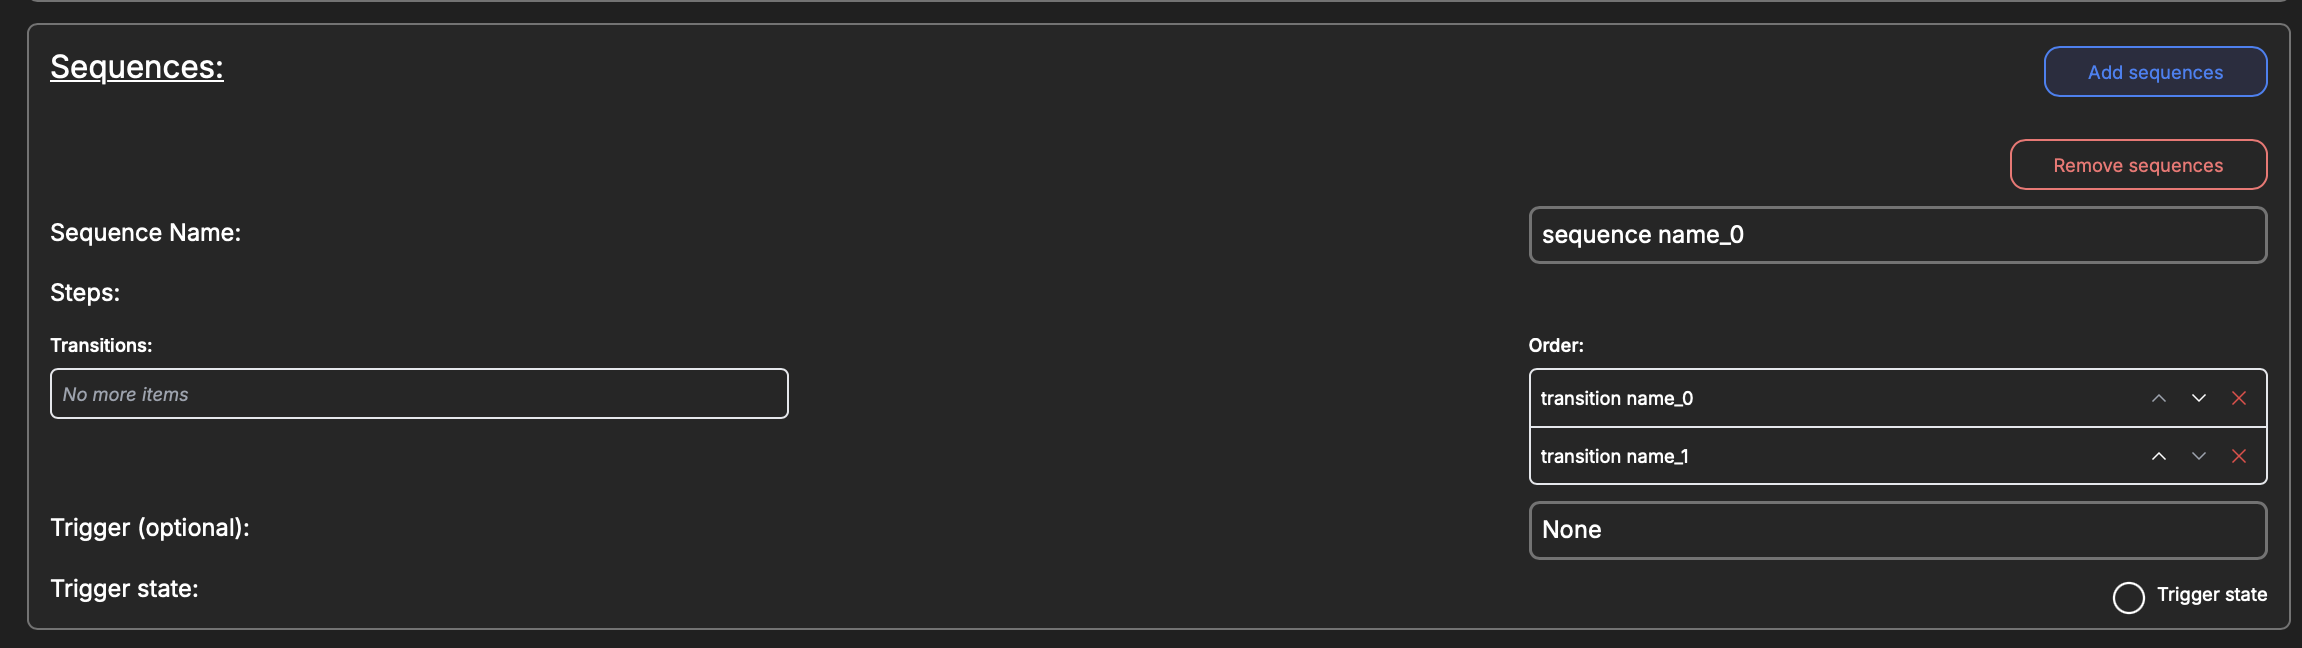
Consider a trigger as an in-firmware emergency-stop.
| Key | Type | Description |
|---|---|---|
| Name | String | User defined name attached to the automation sequence. |
| Steps | Array | Chose and order defined Transitions this sequence should attempt. |
| Trigger | Optional Enum | Choose an already-configured (but not used in this service) Analog-Input or Digital-Input that this sequence should track the state of. |
| Trigger State | Boolean | The state of the configured Trigger that ought to begin this sequence. |
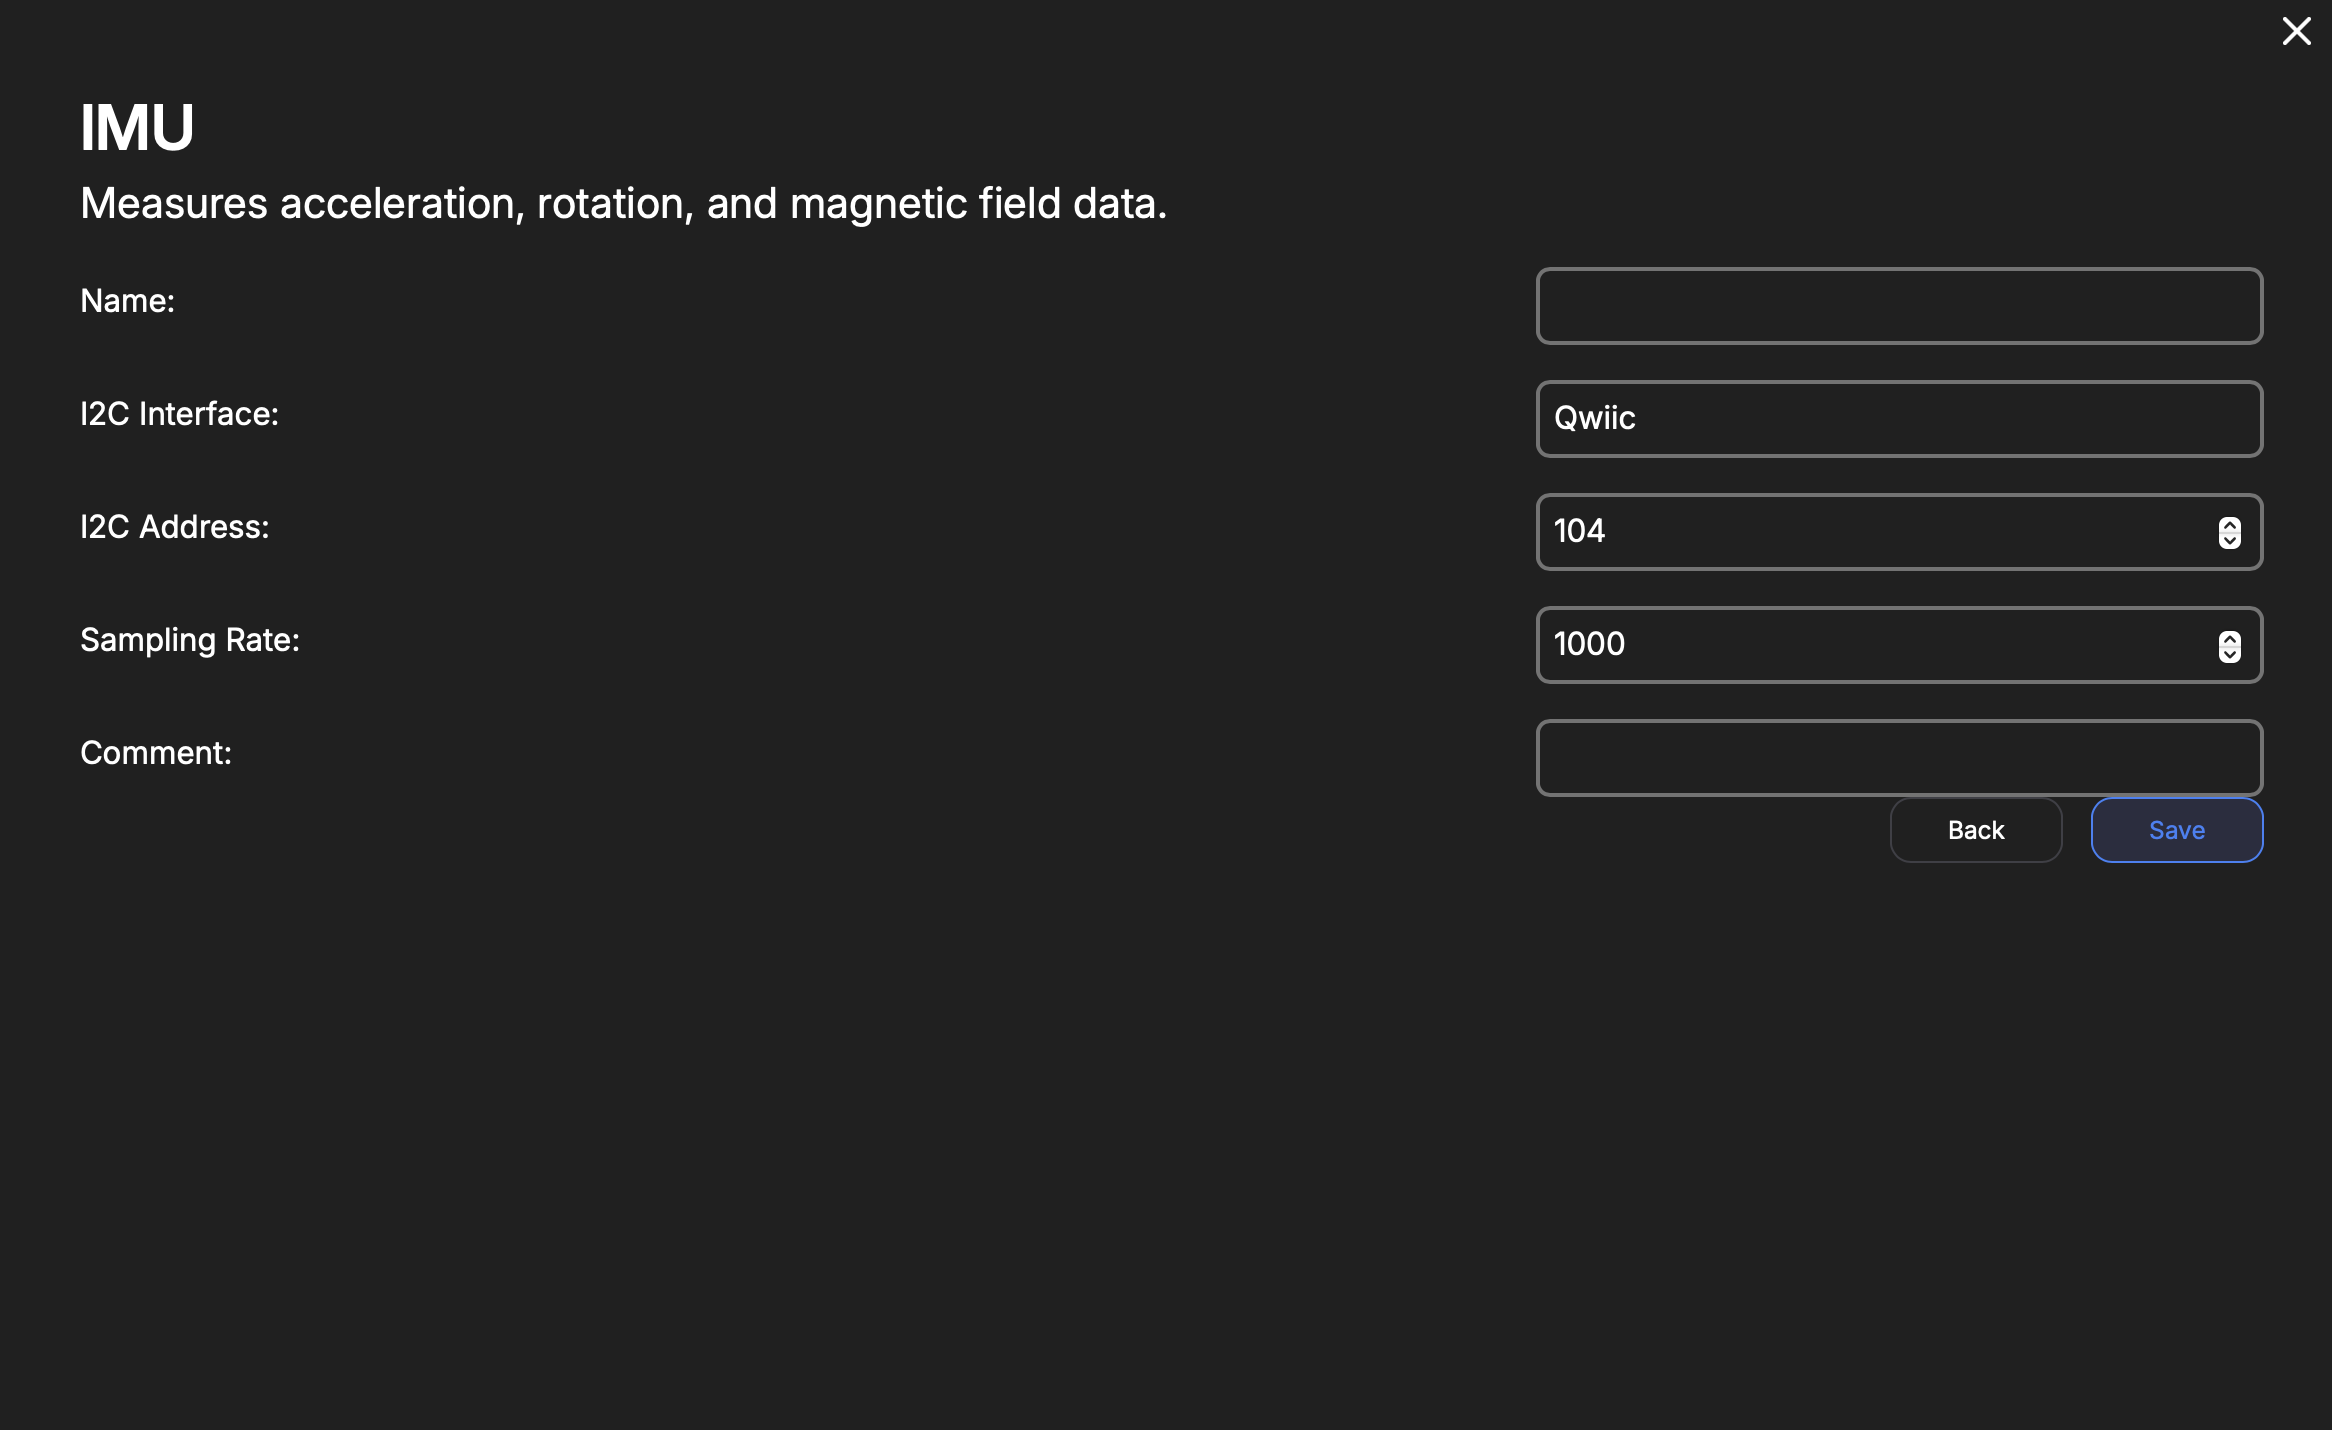
IMU (MPU6050)
| Key | Type | Description |
|---|---|---|
| Name | String | Internal reference to task. |
| I2C Interface | Enum | Qwiic or MikroBus I2C interface. |
| I2C Address | Number | I2C Bus address for the MPU6050. Default is 104. Do not change unless the address is changed on the MPU6050, beforehand. |
| Sampling Rate | Number | Duration, in milliseconds, to sample and send data from the MPU6050. |
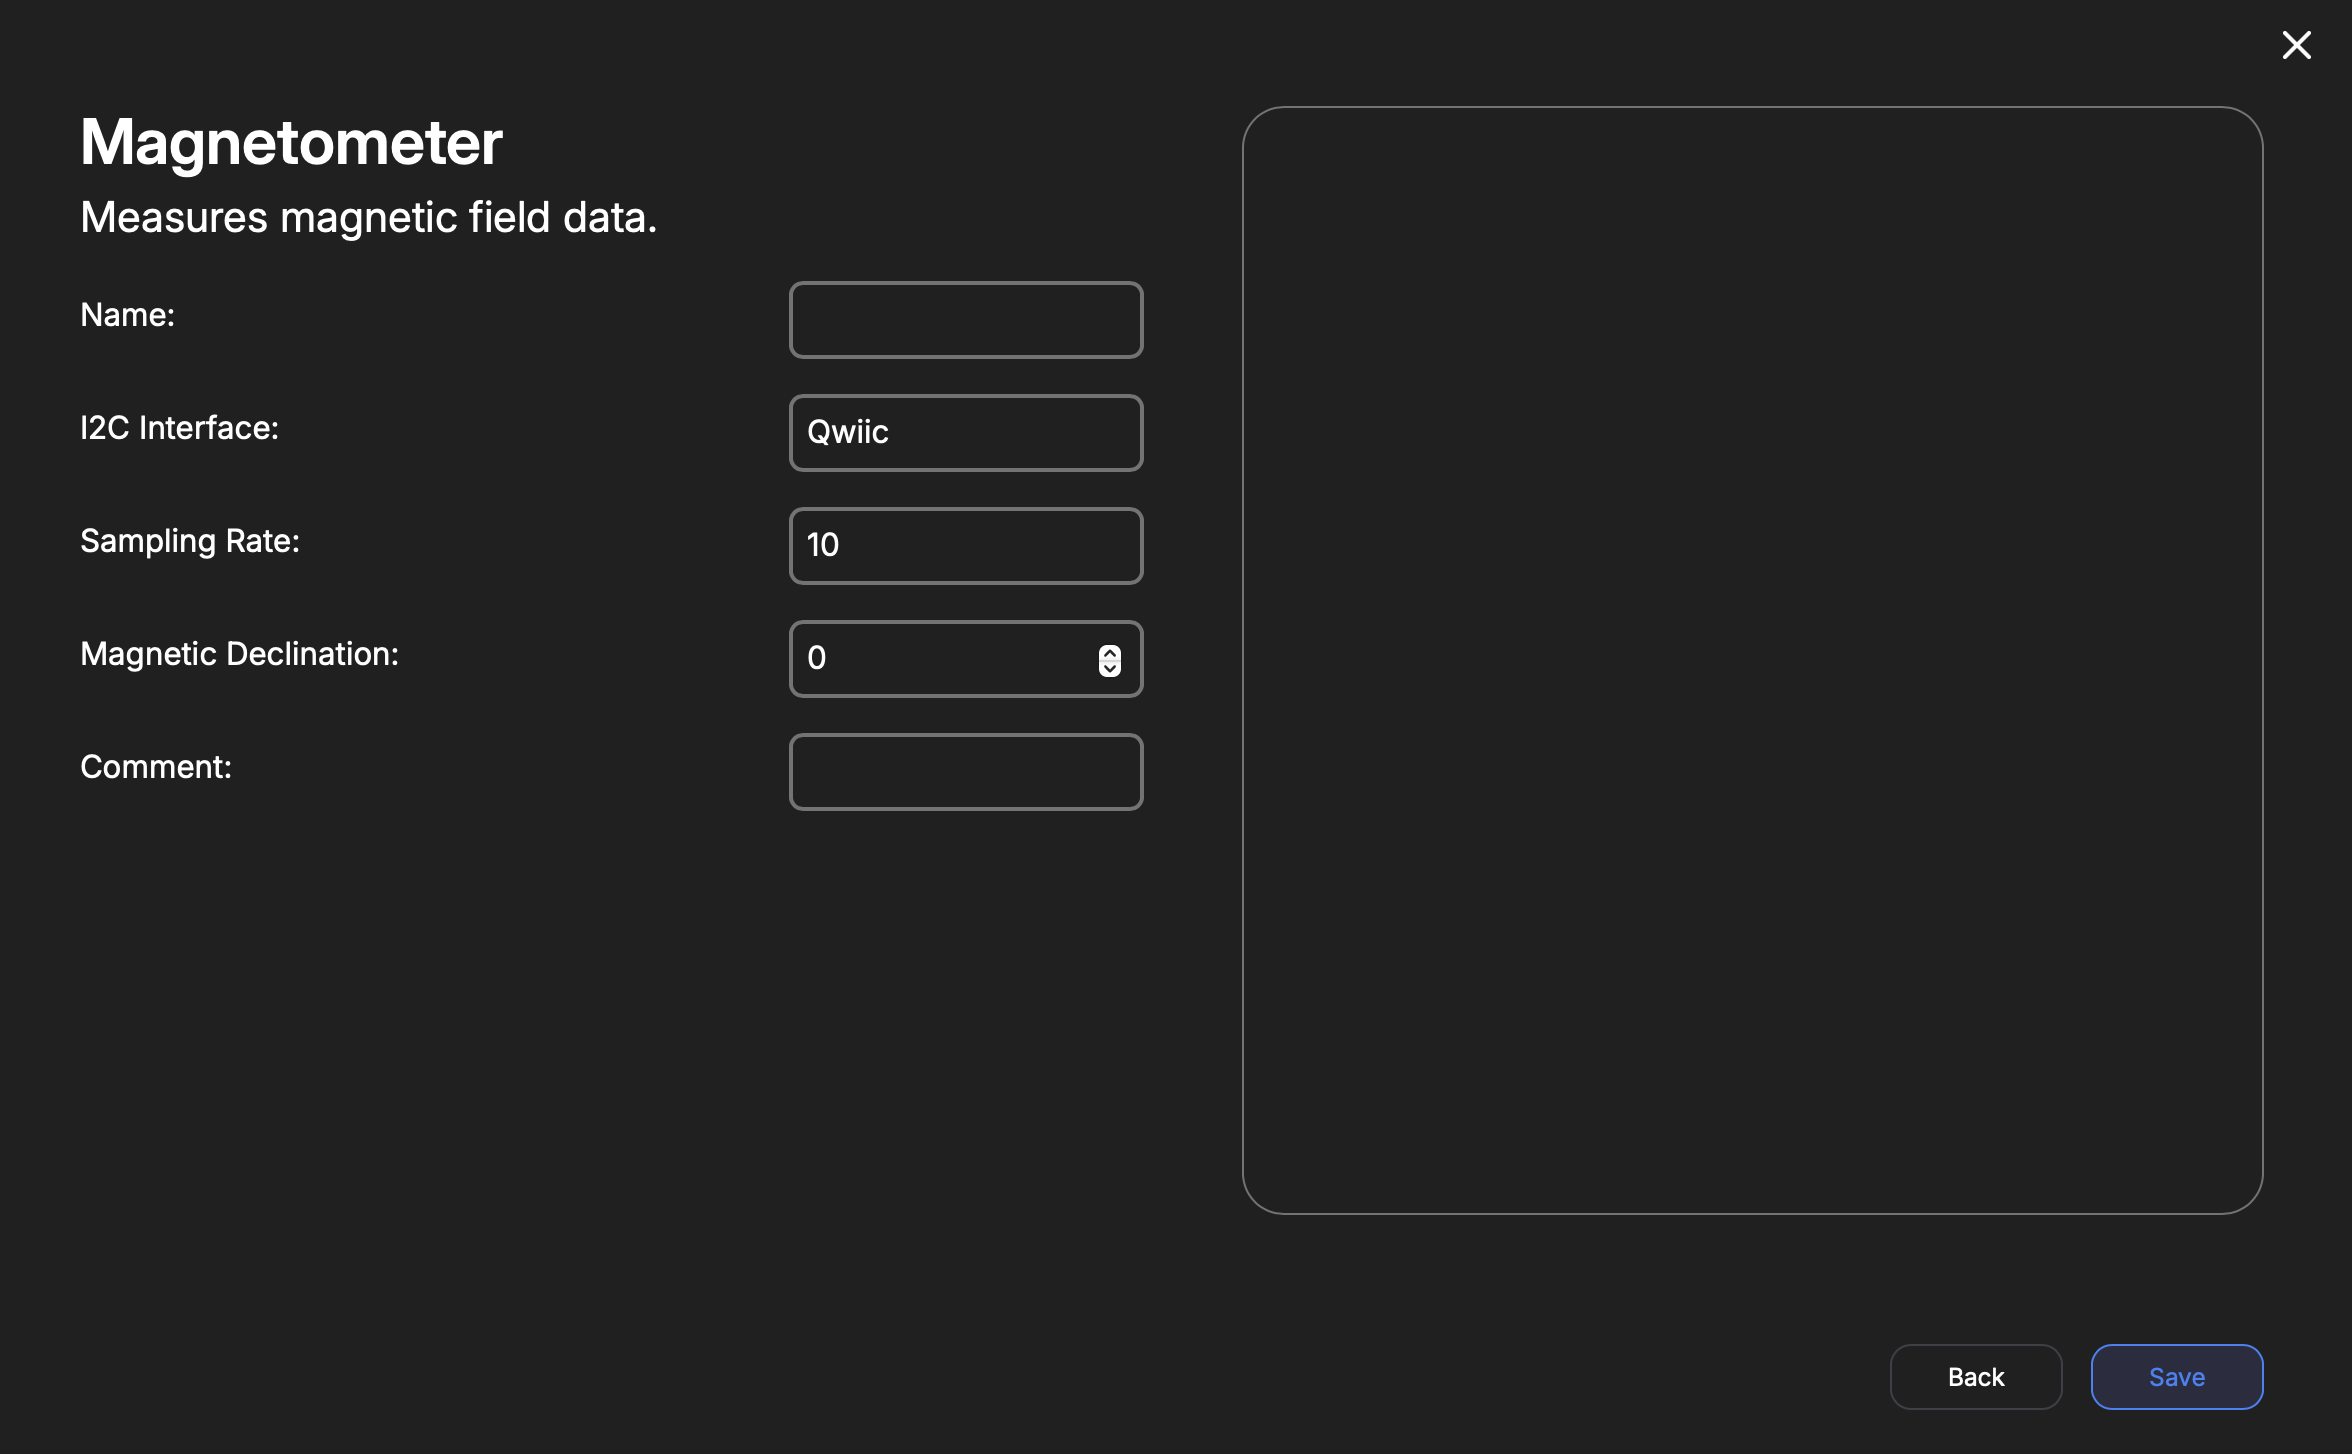
Magnetometer (QMC5883L)
| Key | Type | Description |
|---|---|---|
| Name | String | Internal reference to task. |
| I2C Interface | Enum | Qwiic or Mikrobus interface used. |
| Sampling Rate | Enum | 10, 50, 100, or 200 Sa/s |
| Magnetic Declination | Number | The angular offset of magnetic North from true North at your location. This orients the magnetic compass to treat zero degrees as true North. |
IR Camera (MLX90640)
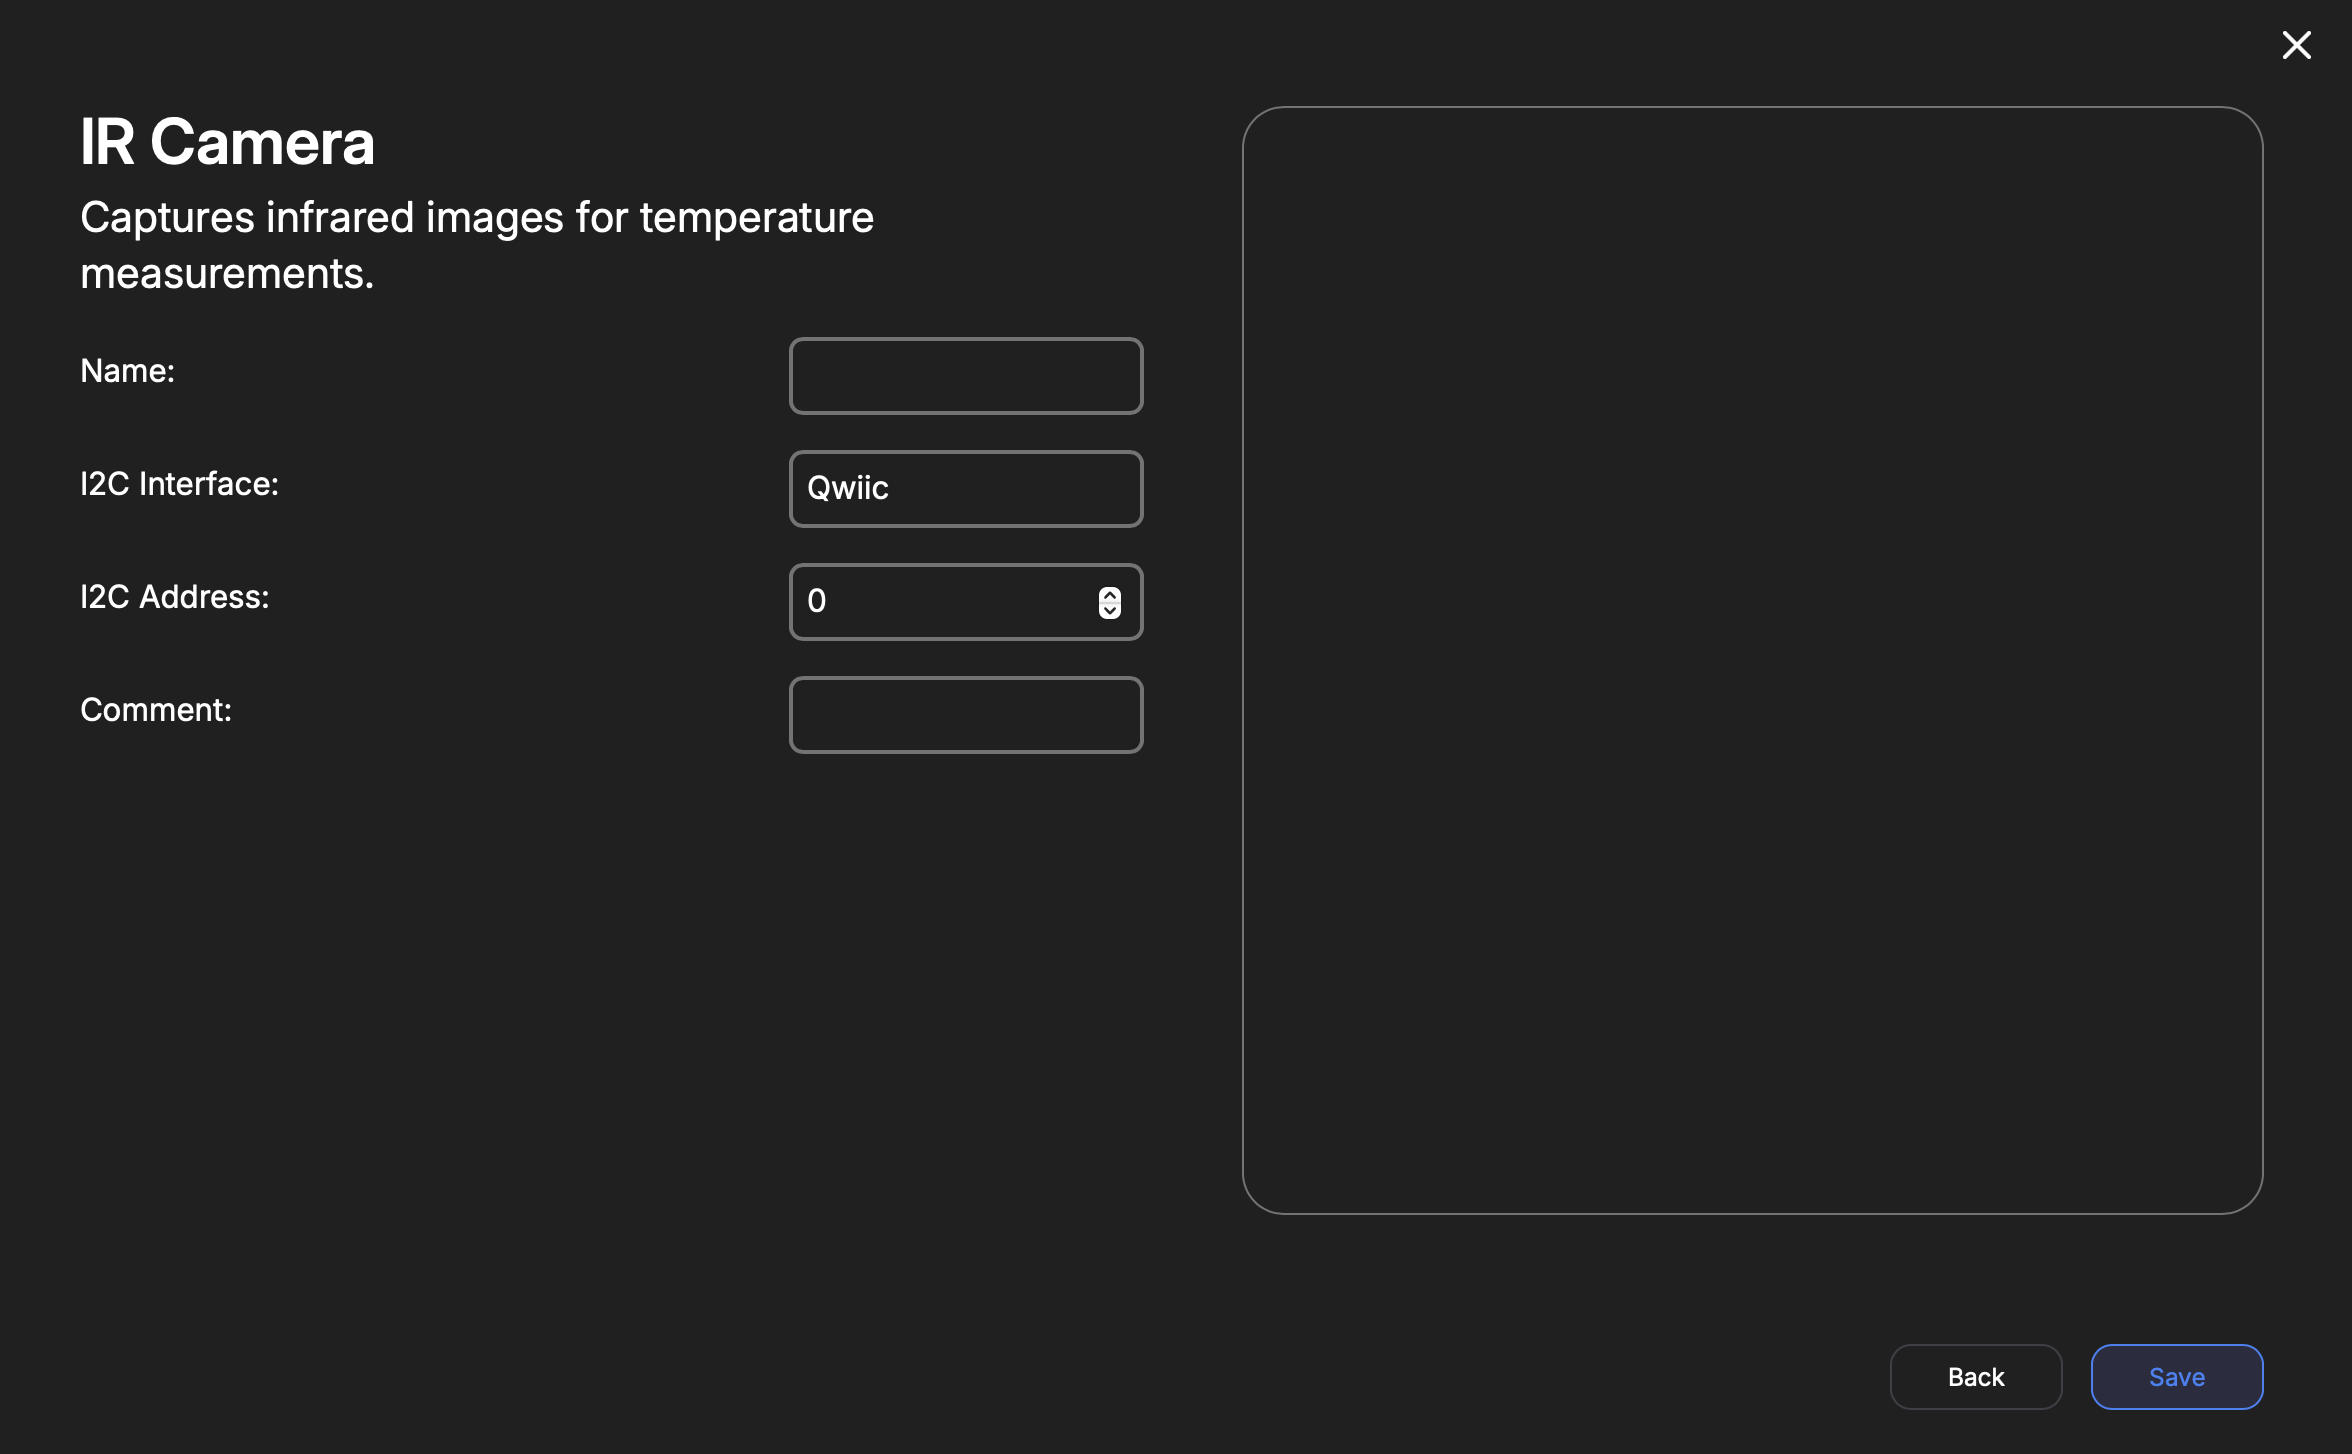
| Key | Type | Description |
|---|---|---|
| Name | String | Internal reference to task. |
| I2C Interface | Enum | Qwiic or Mikrobus interface used. |
| I2C Address | Number | I2C address of MLX90640 IR-camera. Default is 51 (0x33). This field is in decimal, not hex. |
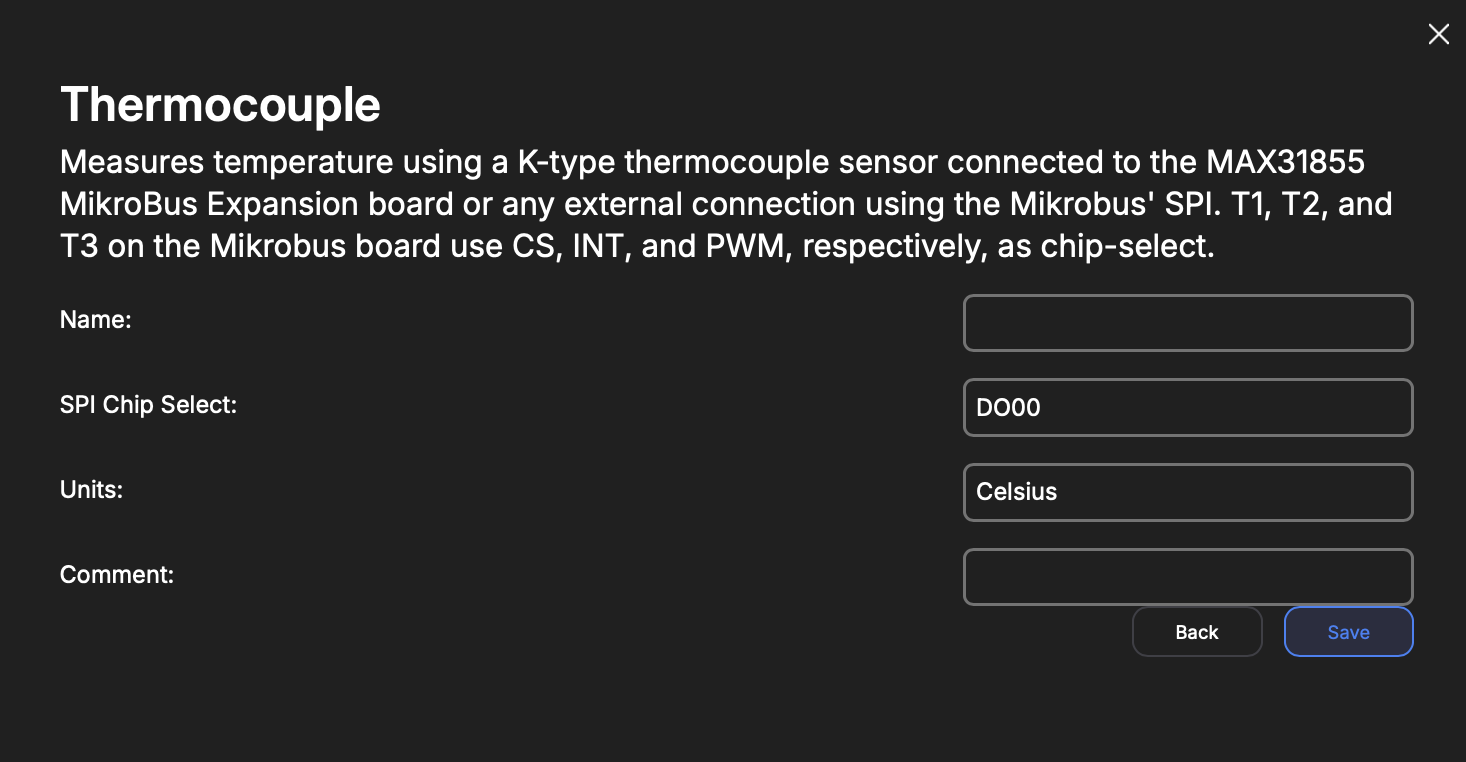
Thermocouple (MAX31855)
| Key | Type | Description |
|---|---|---|
| Name | String | Internal reference to task. |
| SPI Chip Select | Enum | DO Pins or MikroBus I/O. The expansion board provided by TransAstra uses MikroBus CS, INT, and PWM for T1, T2, and T3, respectively. |
| Units | Enum | Celsius, Fahrenheit, or Kelvin |
Load Cell (HX711)
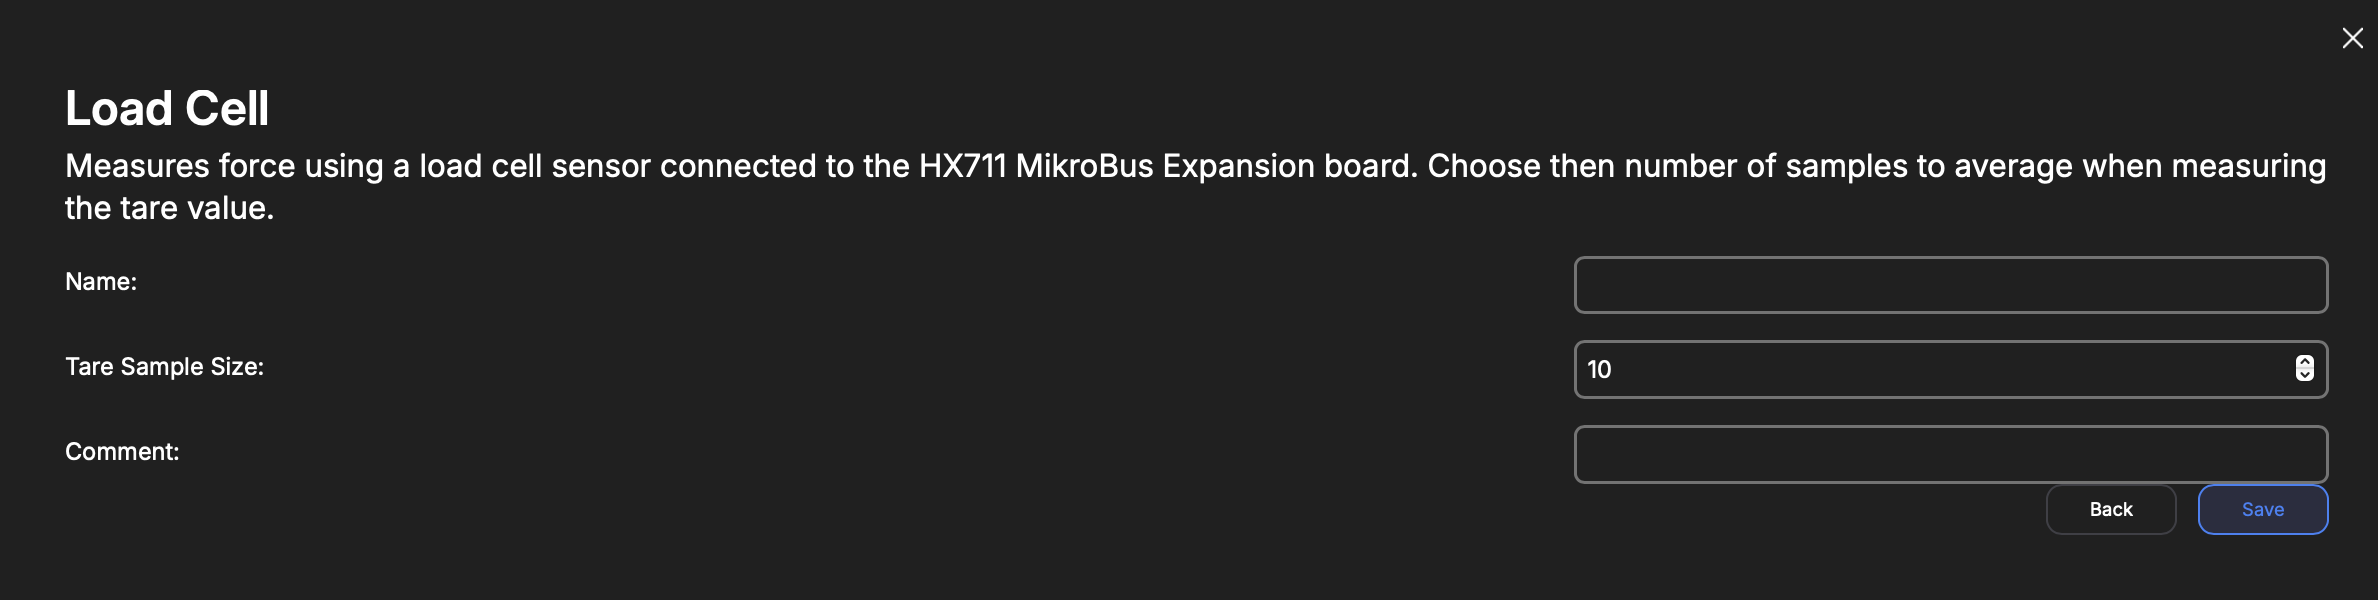
Uses MikroBus SCK and MISO by default for the HX711 data interface.
| Key | Type | Description |
|---|---|---|
| Name | String | Internal reference to task. |
| Tare Sample Size | Int | Number of samples to use when measuring a tare value. |
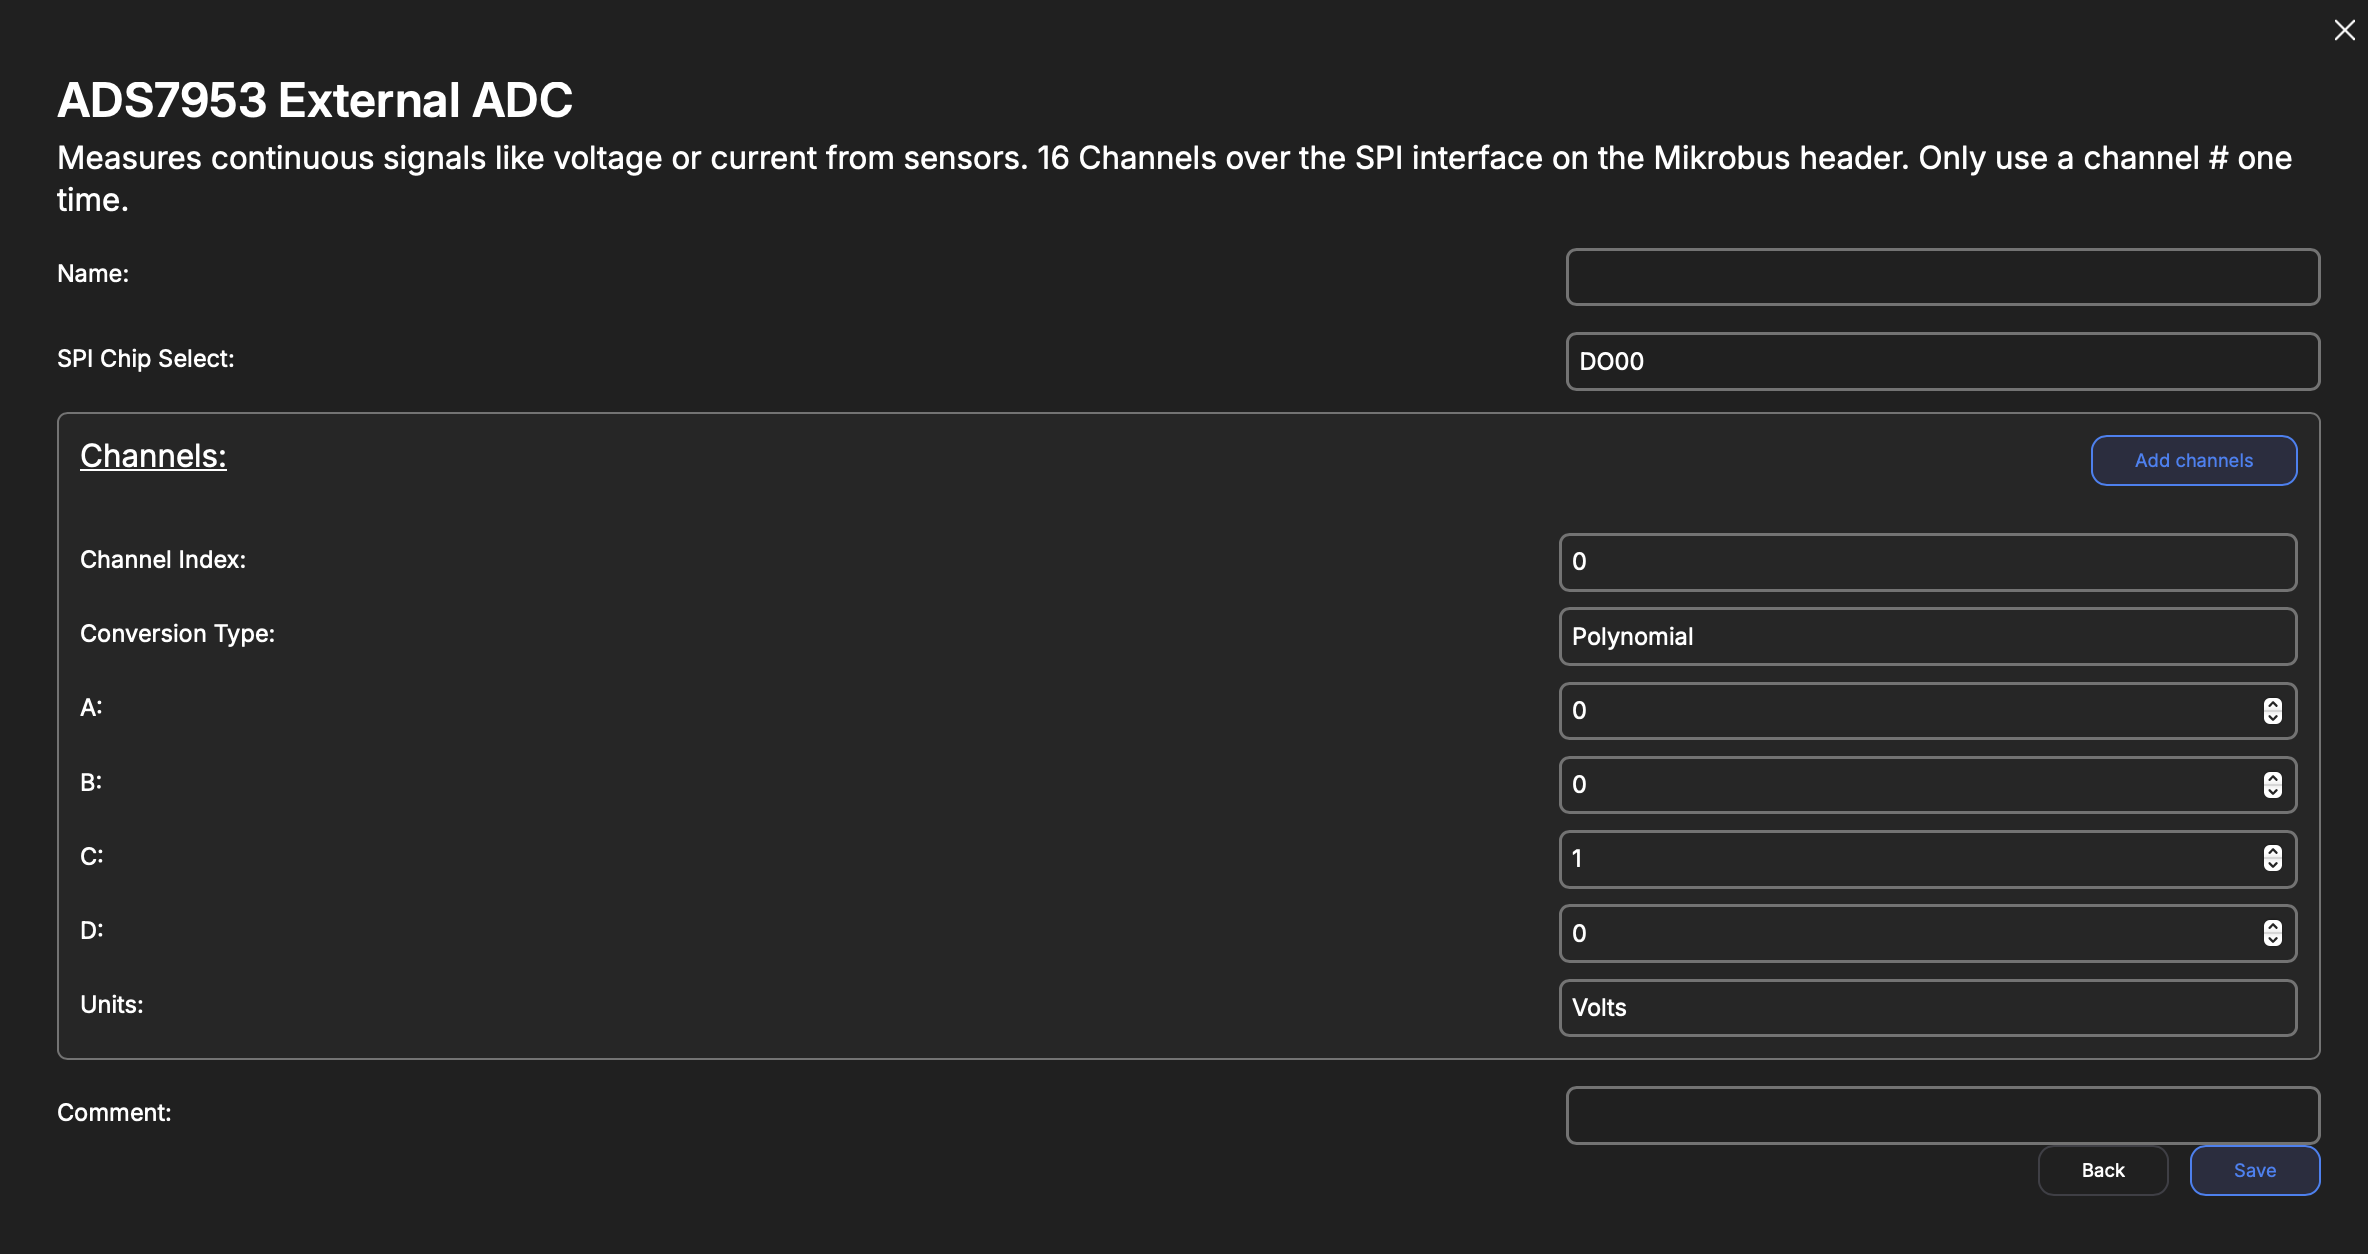
ADS7953
| Key | Type | Description |
|---|---|---|
| Name | String | Internal reference to task. |
| SPI Chip Select | Enum | DO Pins or MikroBus I/O. |
| Channels | Array | An array of Channel objects. Each object corresponds to the conversion and units for a given input to the ADS7953 chip. |
Channel
| Key | Type | Description |
|---|---|---|
| Channel Index | Int | A value 0-15, corresponds to the input on the ADS chip. |
| Type | Enum | Polynomial Logarithmic |
| A | Float | Conversion equation A coefficient |
| B | Float | Conversion equation B coefficient |
| C | Float | Conversion equation C coefficient |
| D | Float | Conversion equation D coefficient |
| Unit | String | Indicates unit of measurement. |
Power-Distribution Unit (PDU)
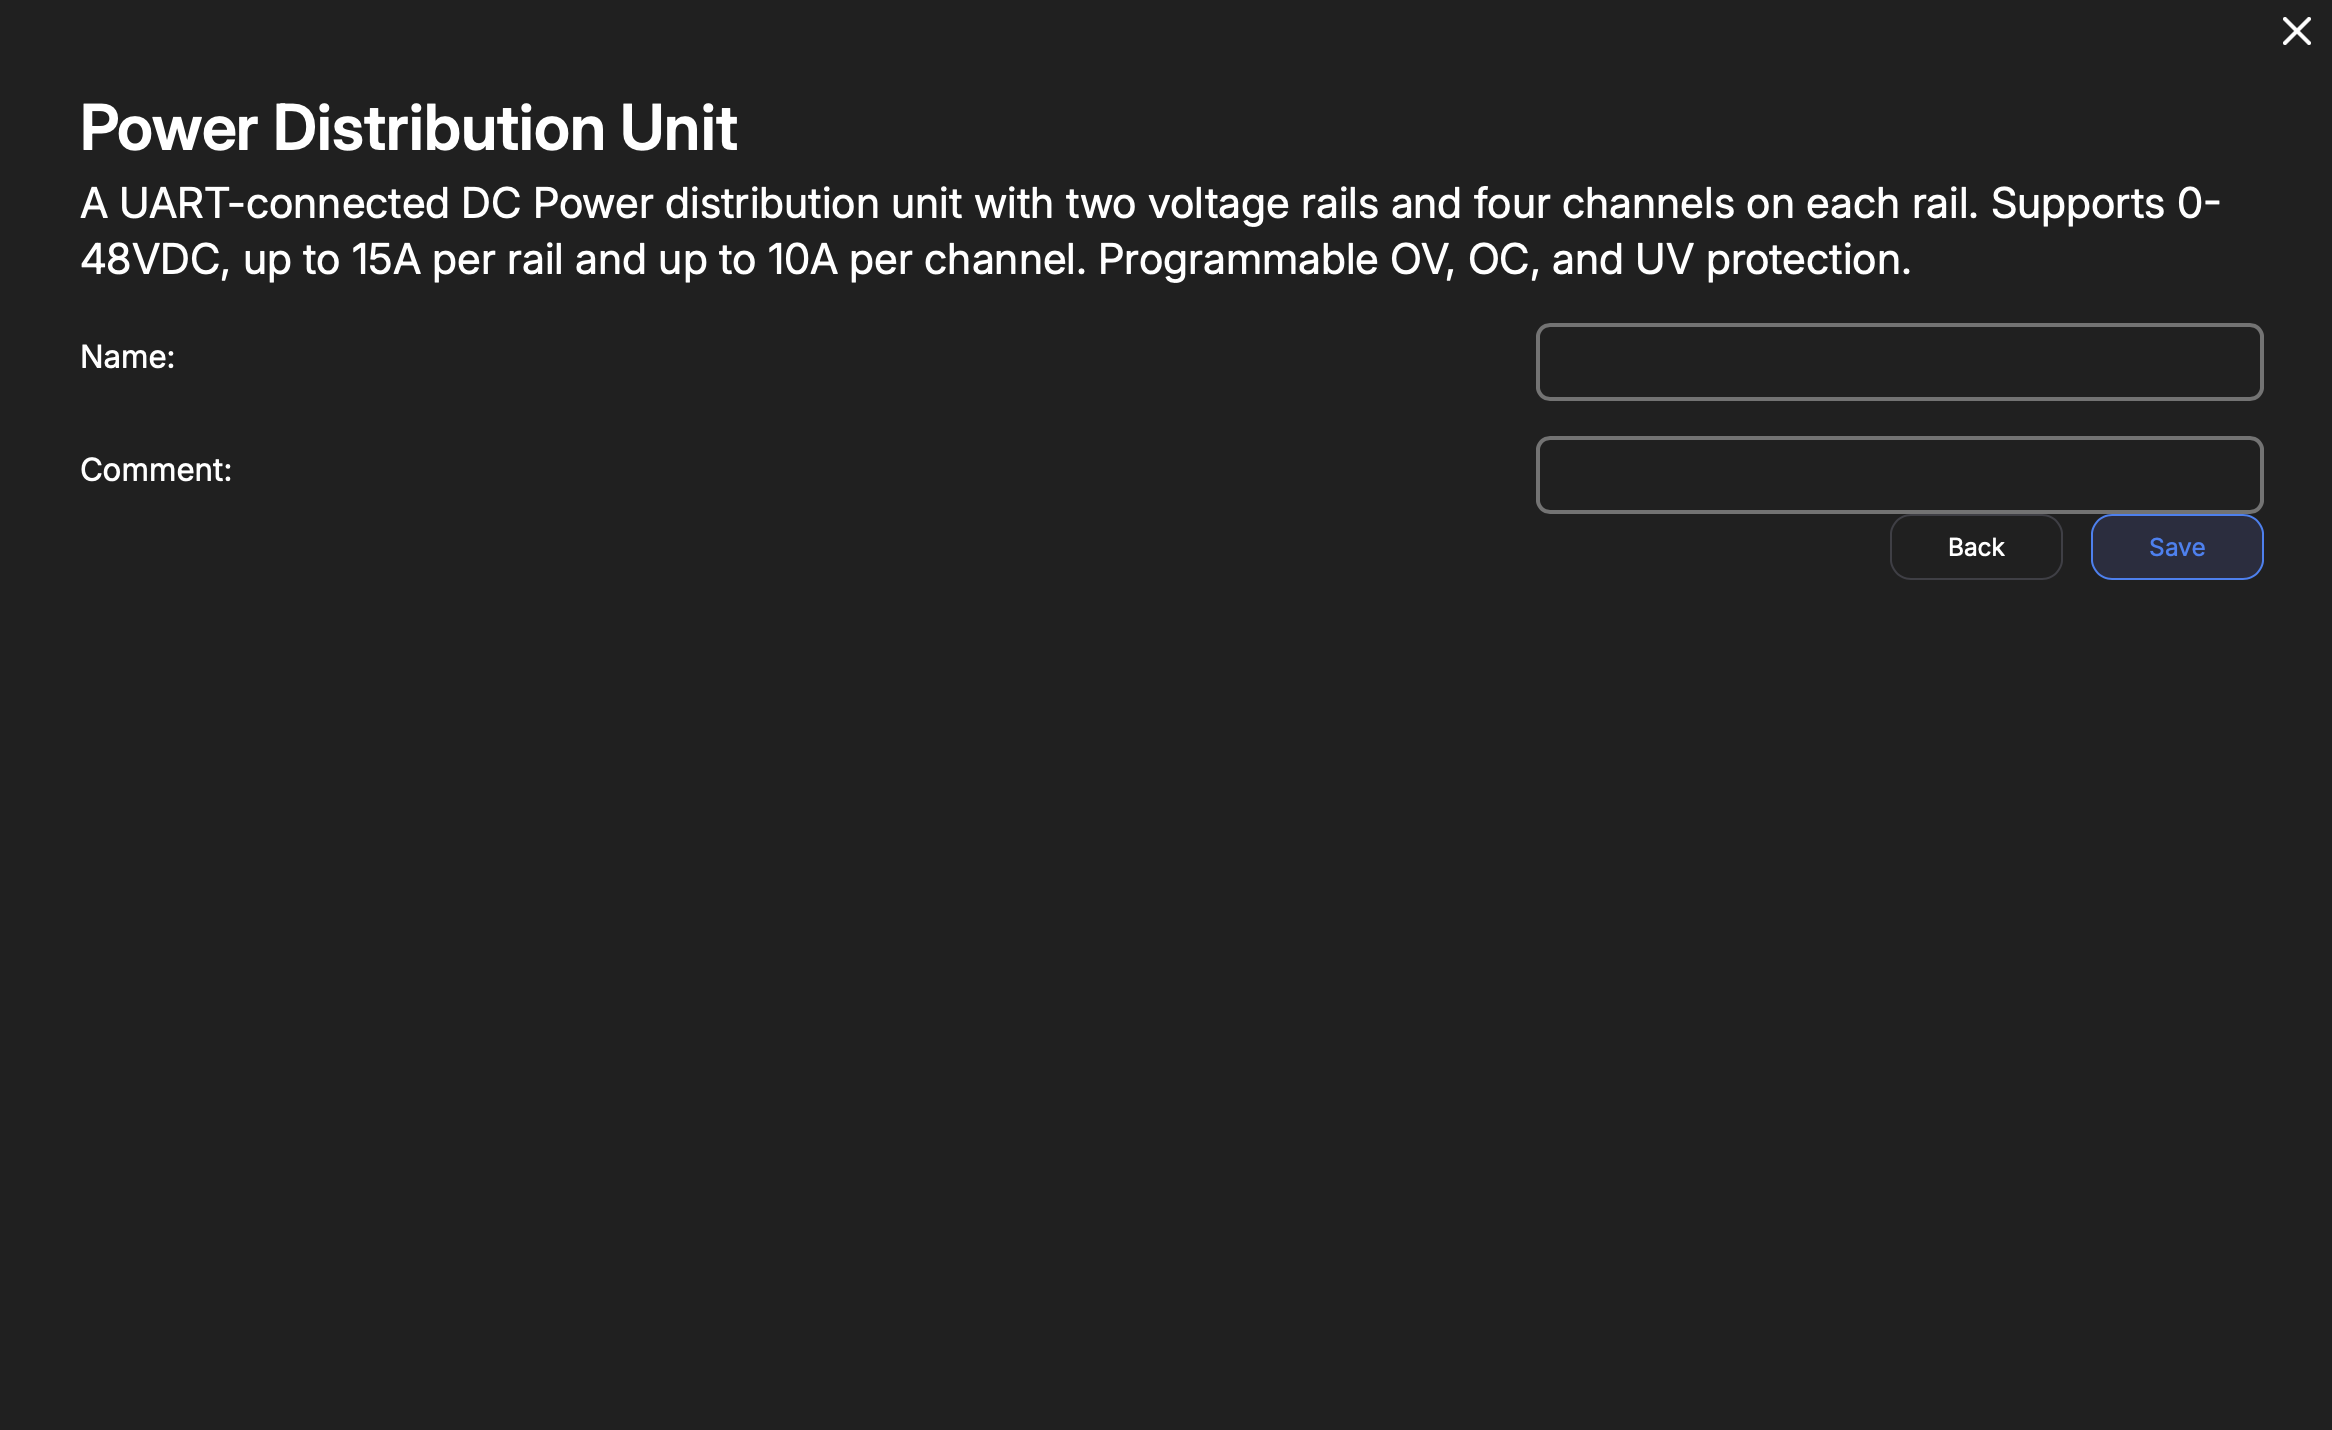
The PDU board will connect to the UART RX & TX pins on the DAQAstra's SuperSeal connector.
| Key | Type | Description |
|---|---|---|
| Name | String | Internal reference to task. |
Version Control
Firmware is version controlled in the DAQAstra application. This means that as the user adds, modifies, or deletes services within a firmware, these changes are tracked along with the comments the user may choose to enter for any given change.
However, since it can be hard for one to track many versions as a user tweaks a given firmware for changing needs or calibration purposes, there are only two cases where a new version is created. If neither of the following conditions are met, then the firmware is edited in-place and the comment is appended to the already existing comment for that version.
The first condition for the creation of a new version is the case where the firmware being edited is current deployed on a DAQAstra, even if the DAQAstra itself is offline. This prevents a change in the firmware definition while a device is in use.
The second condition for generating a new version of a firmware is the case where the firmware version being edited is not the latest version. Since there is a version history that ought to be maintained, if a user edits version 2 while the latest version is version 5, their changes will generate a version 6.
Connecting DAQAstra
Power Supply
Before getting into network setup, ensure there is an appropriate power source for the DAQAstra. If you have access to a PoE switch, both the power and connection are in the same cable, so there is no need for a power supply. If you do not have PoE, you'll need a DC power supply that outputs anywhere in the range of 12-32V and connect it to the AUX power (the top-leftmost pin on the 34-pin header) and any of the ground pins. Refer to the pinout.
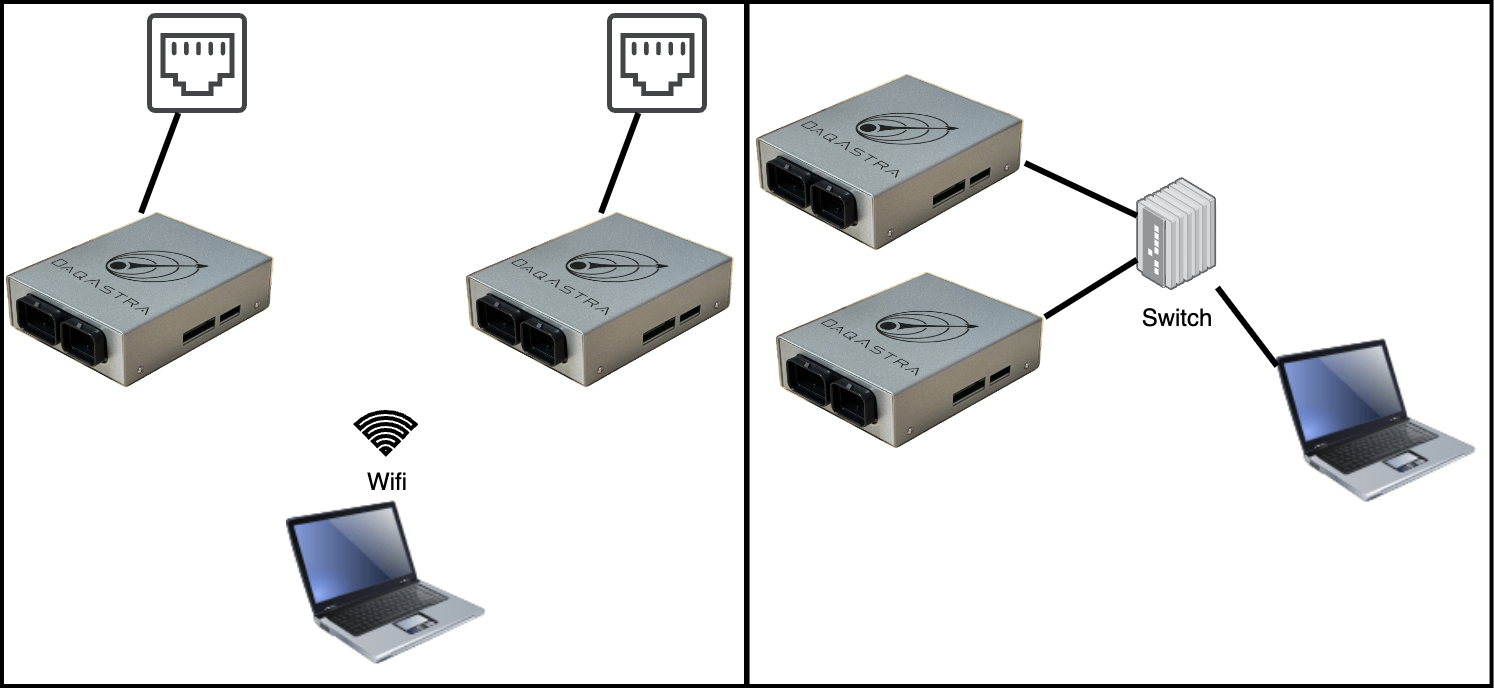
Networking Options
There are two standard network architectures a user can employ in order to use the DAQAstra system.
The most simple approach to connecting a DAQAstra is to use an existing local-area-network (LAN) that provides a DHCP service. This can be as simple as connecting an ethernet cable connecting your WiFi router and DAQAstra and connecting the DAQAstra to a power source. In this case, one computer shall be the host & manager of all DAQAstra(s) on that network.
The second configuration option, Link-Local is for the case where the user wants to plug the DAQAstra(s) directly into their computer without exposing the boards to LAN. This configuration requires the least external hardware, but requires some setup on the user's computer.
Local-Area-Network
Link-Local
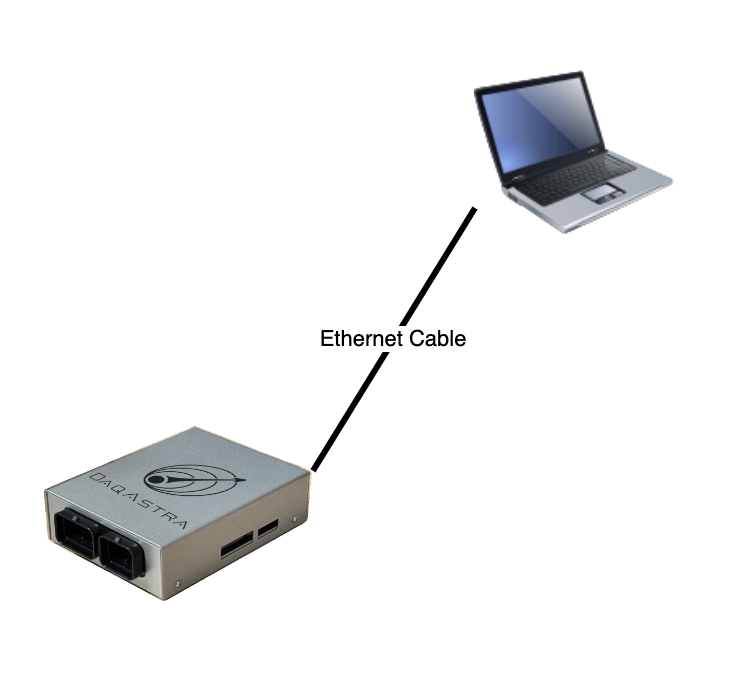
In order to use DAQAstra by plugging it directly into a computer, the user must set a static IP address on the interface that the DAQAstra is connected to. Examples are shown below of how to do this on Windows, MacOS, and Ubuntu.
All DAQAstras are shipped from the factory with a default static IP Address of 10.0.0.6. This is configurable and will be covered.
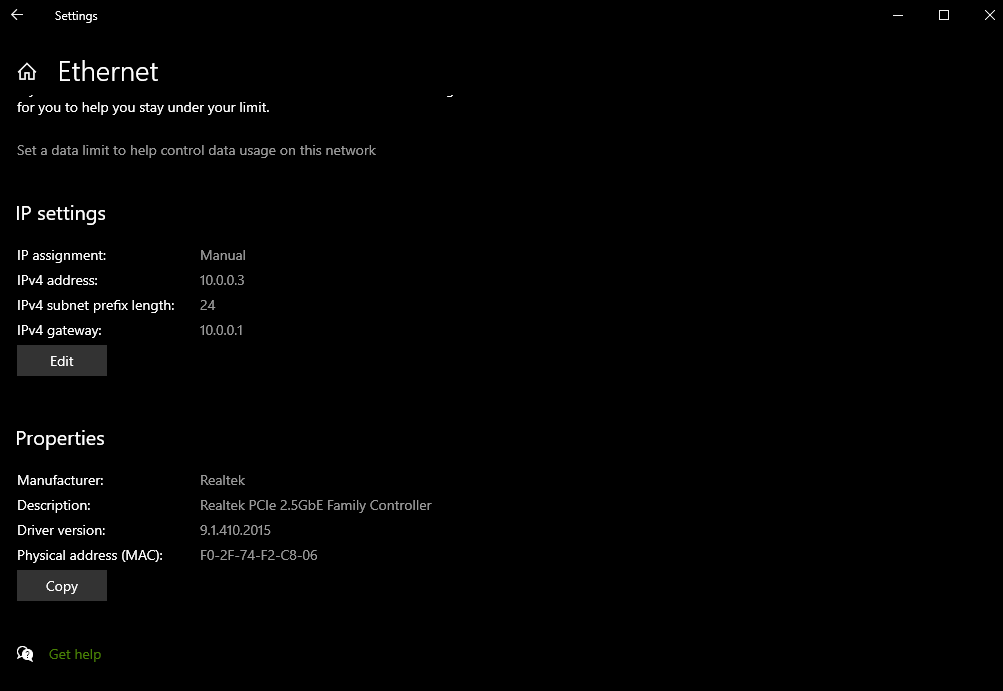
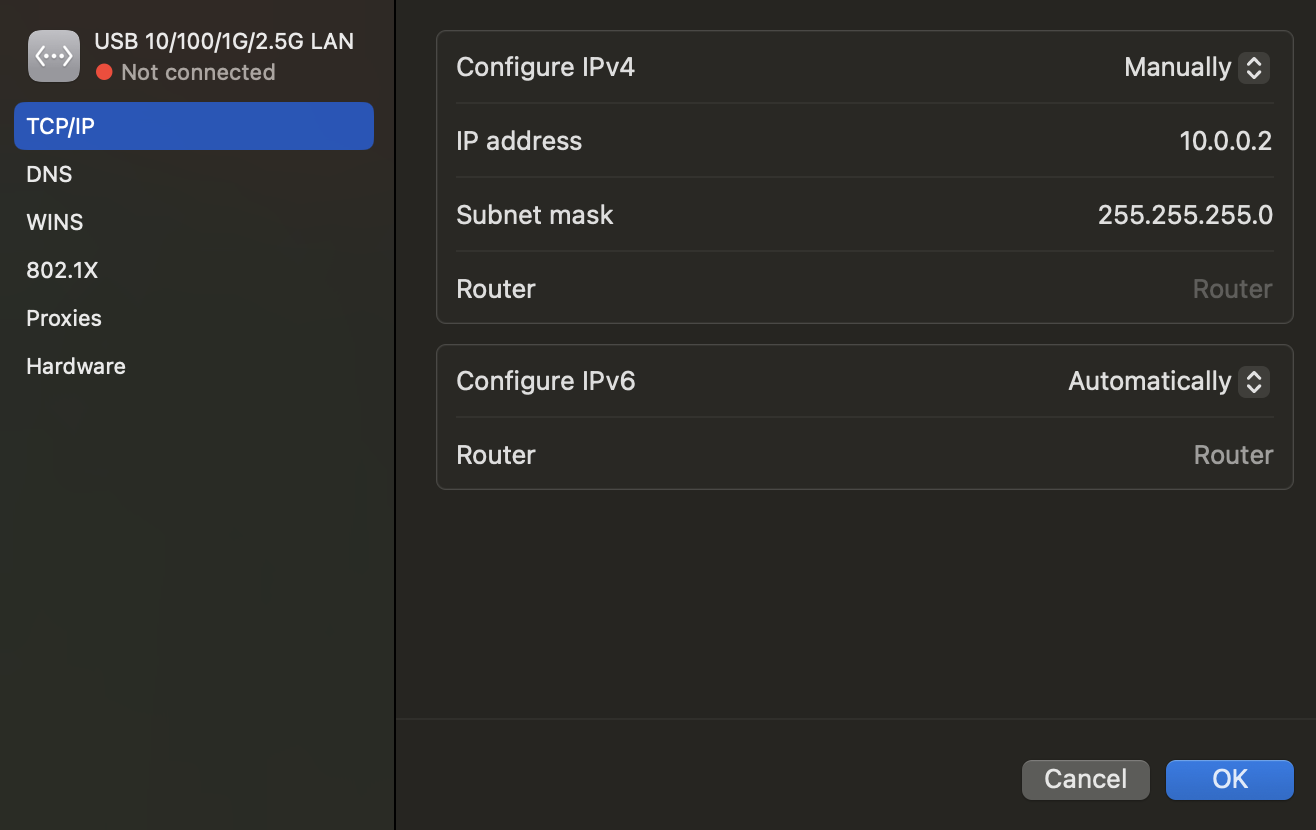
Generally, it would be sufficient to set your network interface to have the following settings:
- IP Address: 10.0.0.2
- Subnet Mask: 255.255.255.0
- Gateway/Router: 10.0.0.1 (Leave unset, if possible)
After doing this, plugging a DAQAstra to the configured interface should result in a new Factory device in the Device Pool list in the UI. If this does not happen, check the following:
-
Is the DAQAstra powered? Is the Ethernet link (green) LED on? If not, check the cable connection.
-
If the link LED is lit, try opening a terminal window and run
ping 10.0.0.6to ping the IP address of the connected DAQAstra at its default address. The activity LED (yellow) should blink too. If not, likely, the interface configuration has an error. -
If on Windows, be sure to add the DAQAstra executable to the allow list in firewall settings. You can do this via the 'Let An Application through Windows Firewall' configuration page via Windows search.
Assuming the DAQAstra connects, you now have the ability to modify its default static IP address via the application. This is an important step if multiple DAQAstras are desired on link-local as each one will need to use a different static IP address. In this situation, only connect a single DAQAstra at a time, adjust that DAQAstra's default address, then plug in the next and do the same.
One can also migrate the DAQAstras off of the 10.0.0.X subnet using this same methodology if it is not available for use for your purposes. Simply change each DAQAstra's default static IP address to the new subnet one at a time and finally change the application host computer's interface IP configuration to use an address on the desired subnet.
Windows Link-Local Setup
MacOSX Link-Local Setup
-
Locate a USB-C to Ethernet adapter to use with your Mac if there is no integrated ethernet port on your system.
-
Plug it in. This will create a new
Serviceunder the Network tab in System Settings. -
Click on the service and then click
Details. UnderTCP/IPyou'll be able to input the settings mentioned above after settingConfigure IPv4toManually.
Linux Link-Local Setup
Recovering a DAQAstra
If your DAQAstra is not showing up on the application interface and the network is already properly setup for the current system configuration, then follow these steps where the procedure to flash the factory firmware onto the DAQAstra via USB programmer are laid out.
If unsure about the network setup, refer to
Connecting DAQAstra.
Materials & Setup
-
A power source for the DAQAstra. One of the below will suffice:
- Power-Over-Ethernet (PoE), e.g. an RJ45 cable to an ethernet switch that supplies PoE.
- 12-32V DC on Auxilliary Power inputs on the SuperSeal.
-
Female-to Male-jumper wires
-
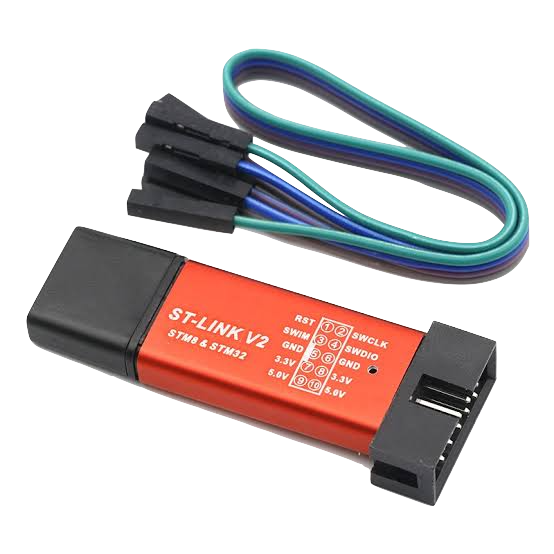
An STLink (pictured below). Should the machine hosting the DAQAstra application lack a USB-A port, a USB-C to USB-A adapter will be needed, too.
If the host is running Windows, the STLink USB Device drivers must be installed. Get them here.
Procedures
- Ensure the DAQAstra is not powered & there is no ethernet cable plugged in.
- Remove the lid of the DAQAstra enclosure.
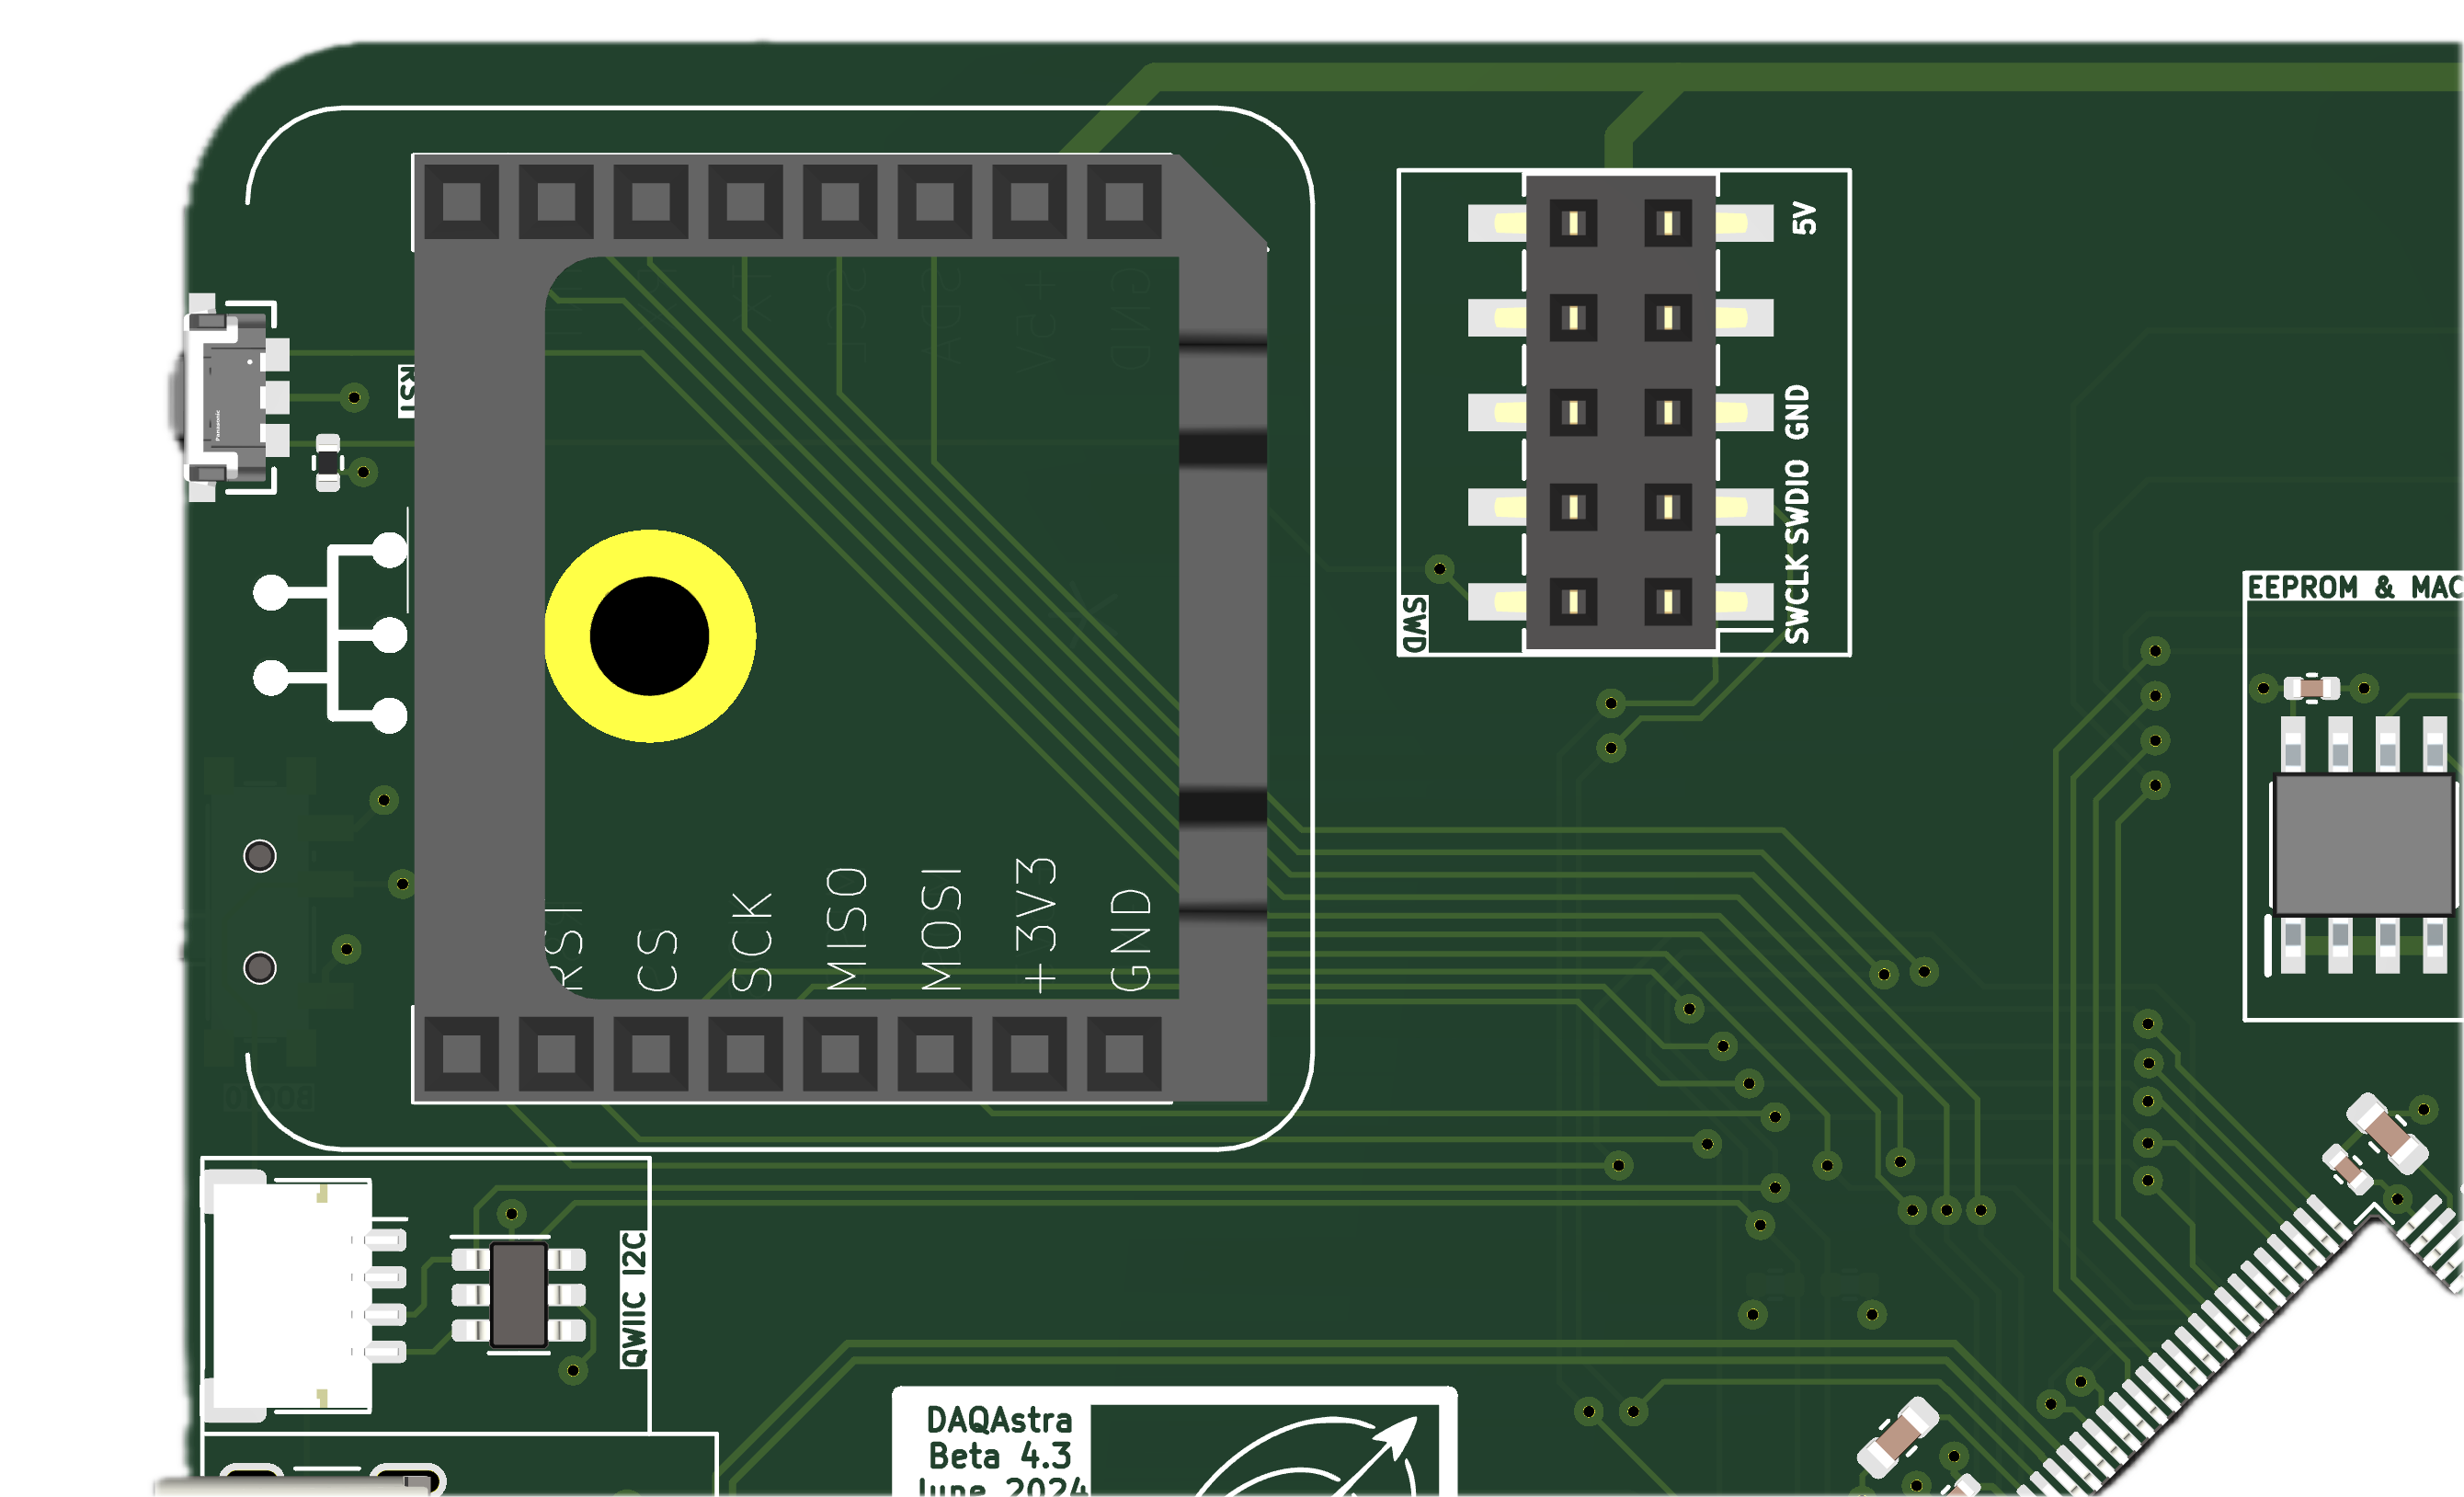
- Using the three jumper wires, connect the STLink's SWCLK, SWDIO, and GND pins (refer to legend on the STLink noting the depection of the connector shroud's knotch) to the DAQAstra's program header, which also has labels, shown below.
- Start the DAQAstra application if it isn't running already. Then click on the
USBicon to open the recovery function in the UI.
- At this point, the STLink probe is not plugged in, so the following page will show up.
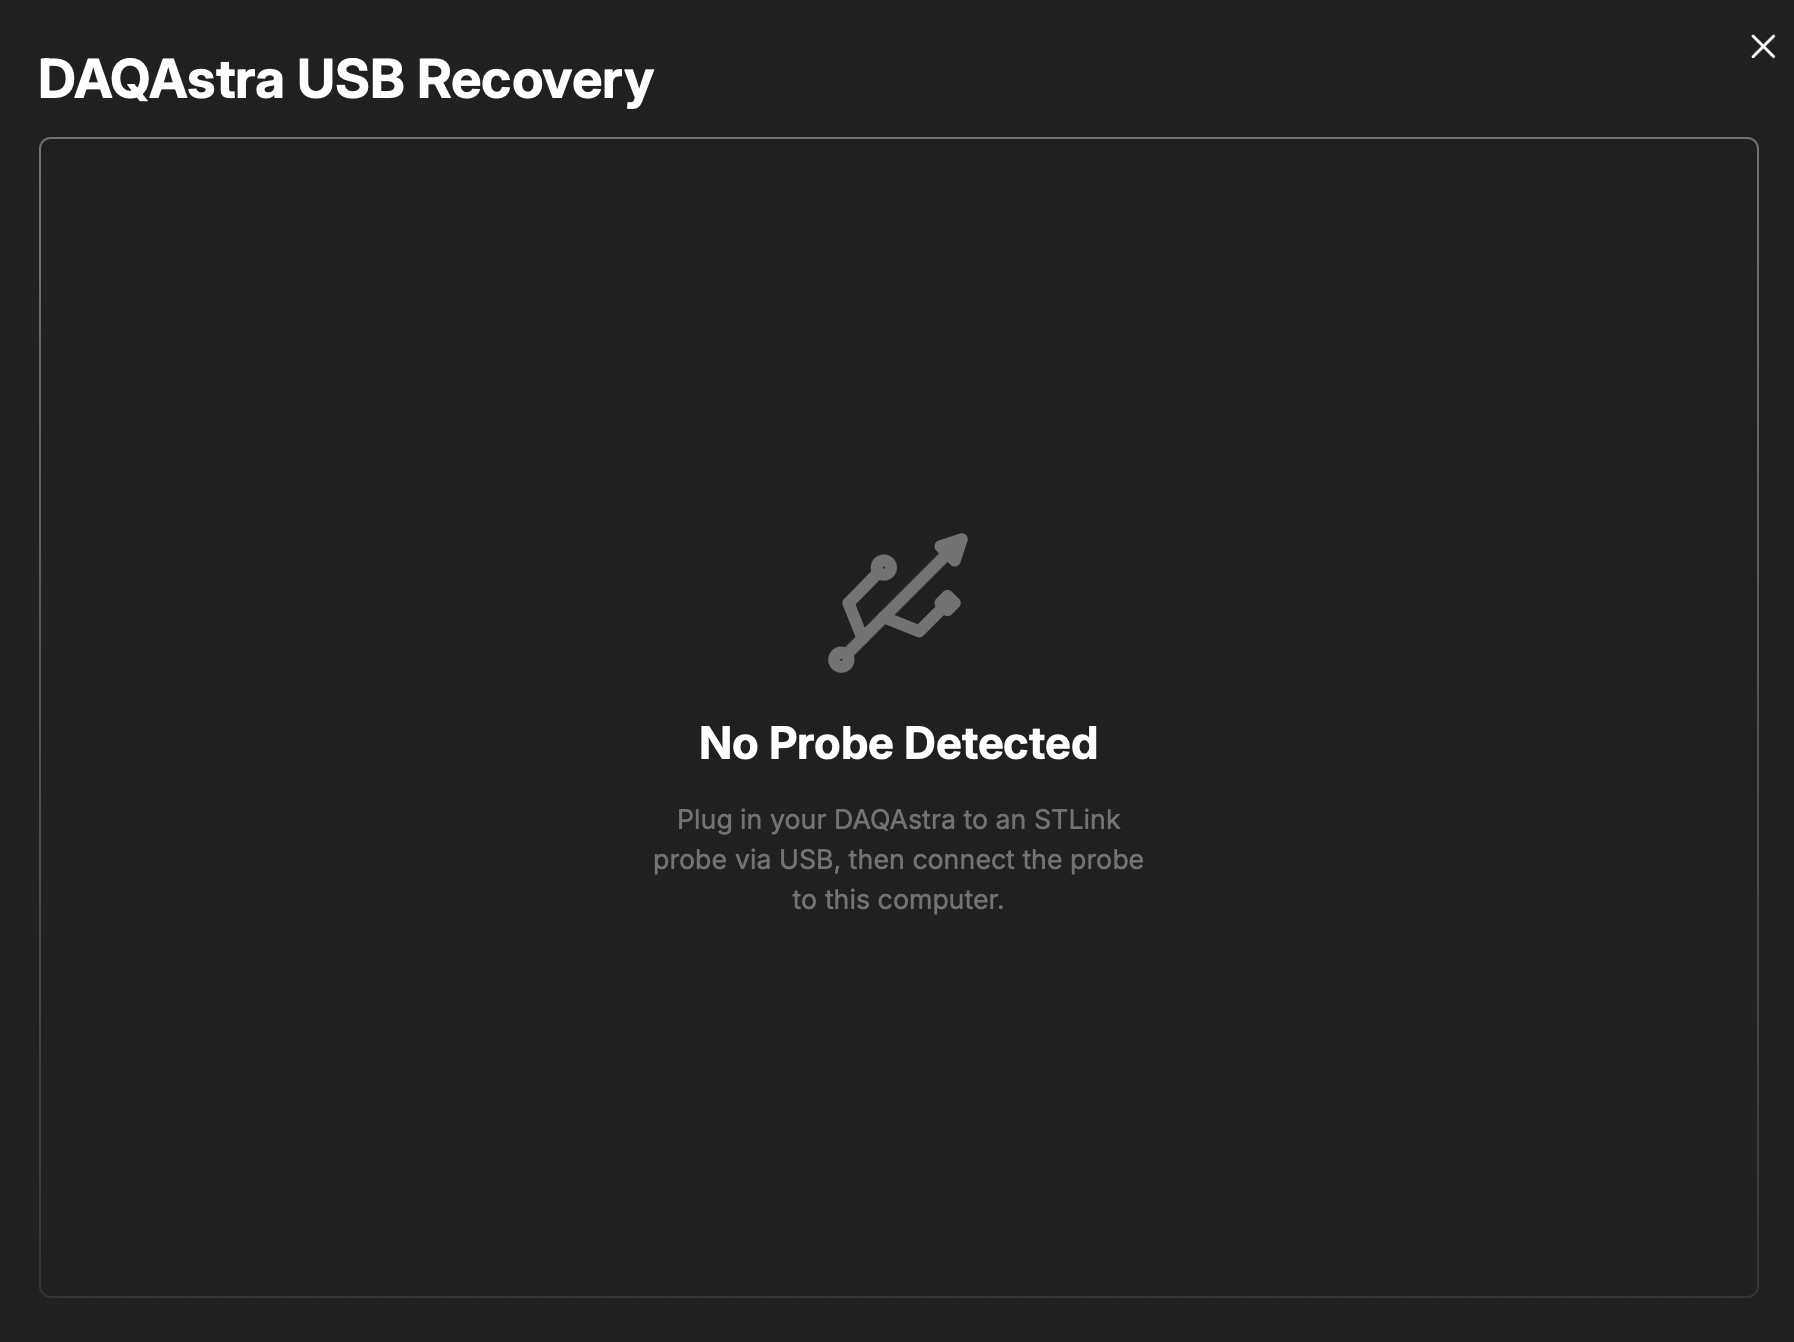
- Plug in the STLink to the machine hosting the DAQAstra application, then power the DAQAstra via the chosen power source. The STLink should show up and the page should update to show the following page.
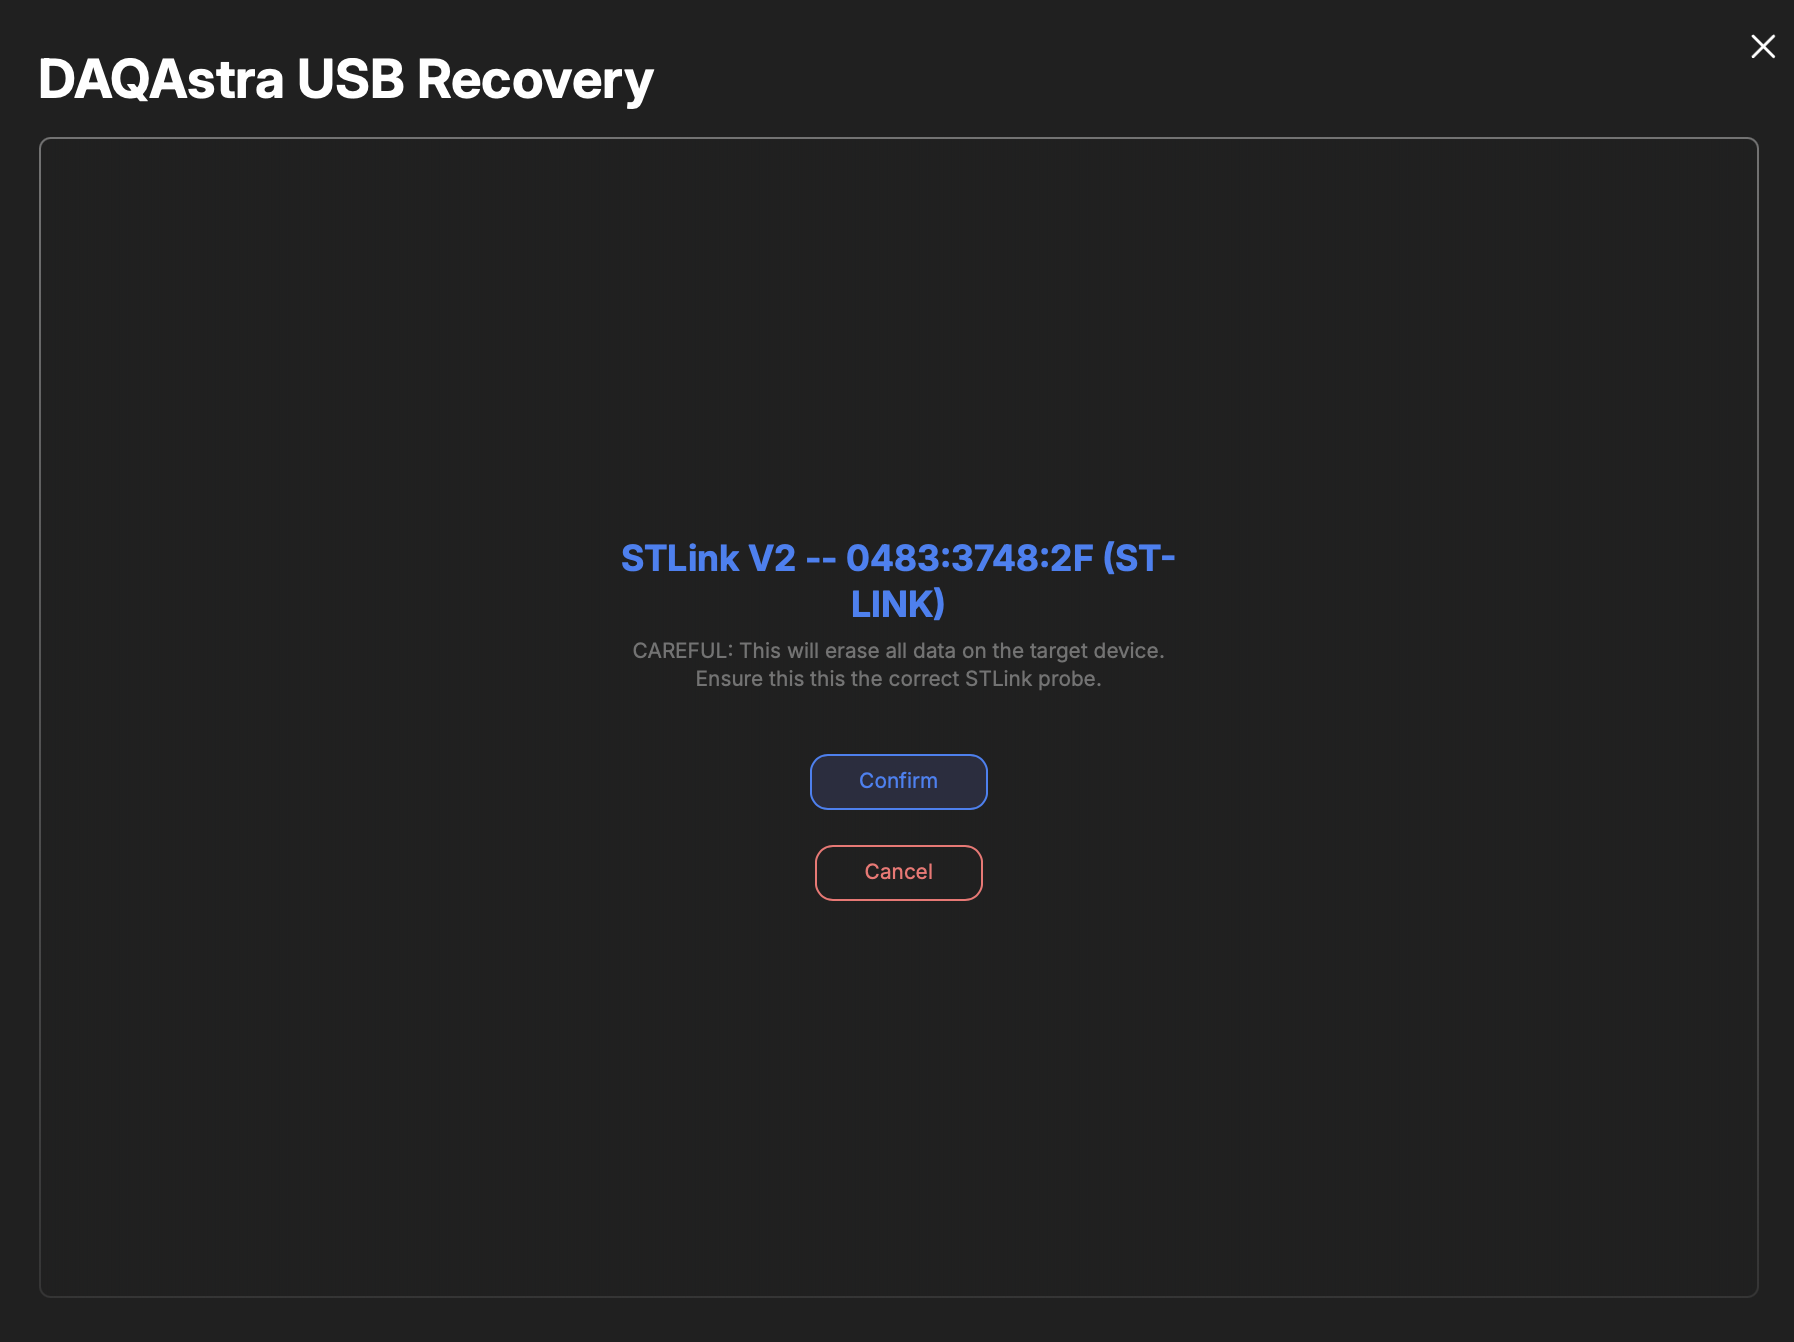
- Click
Confirm, then select the hardware revision of the target DAQAstra.
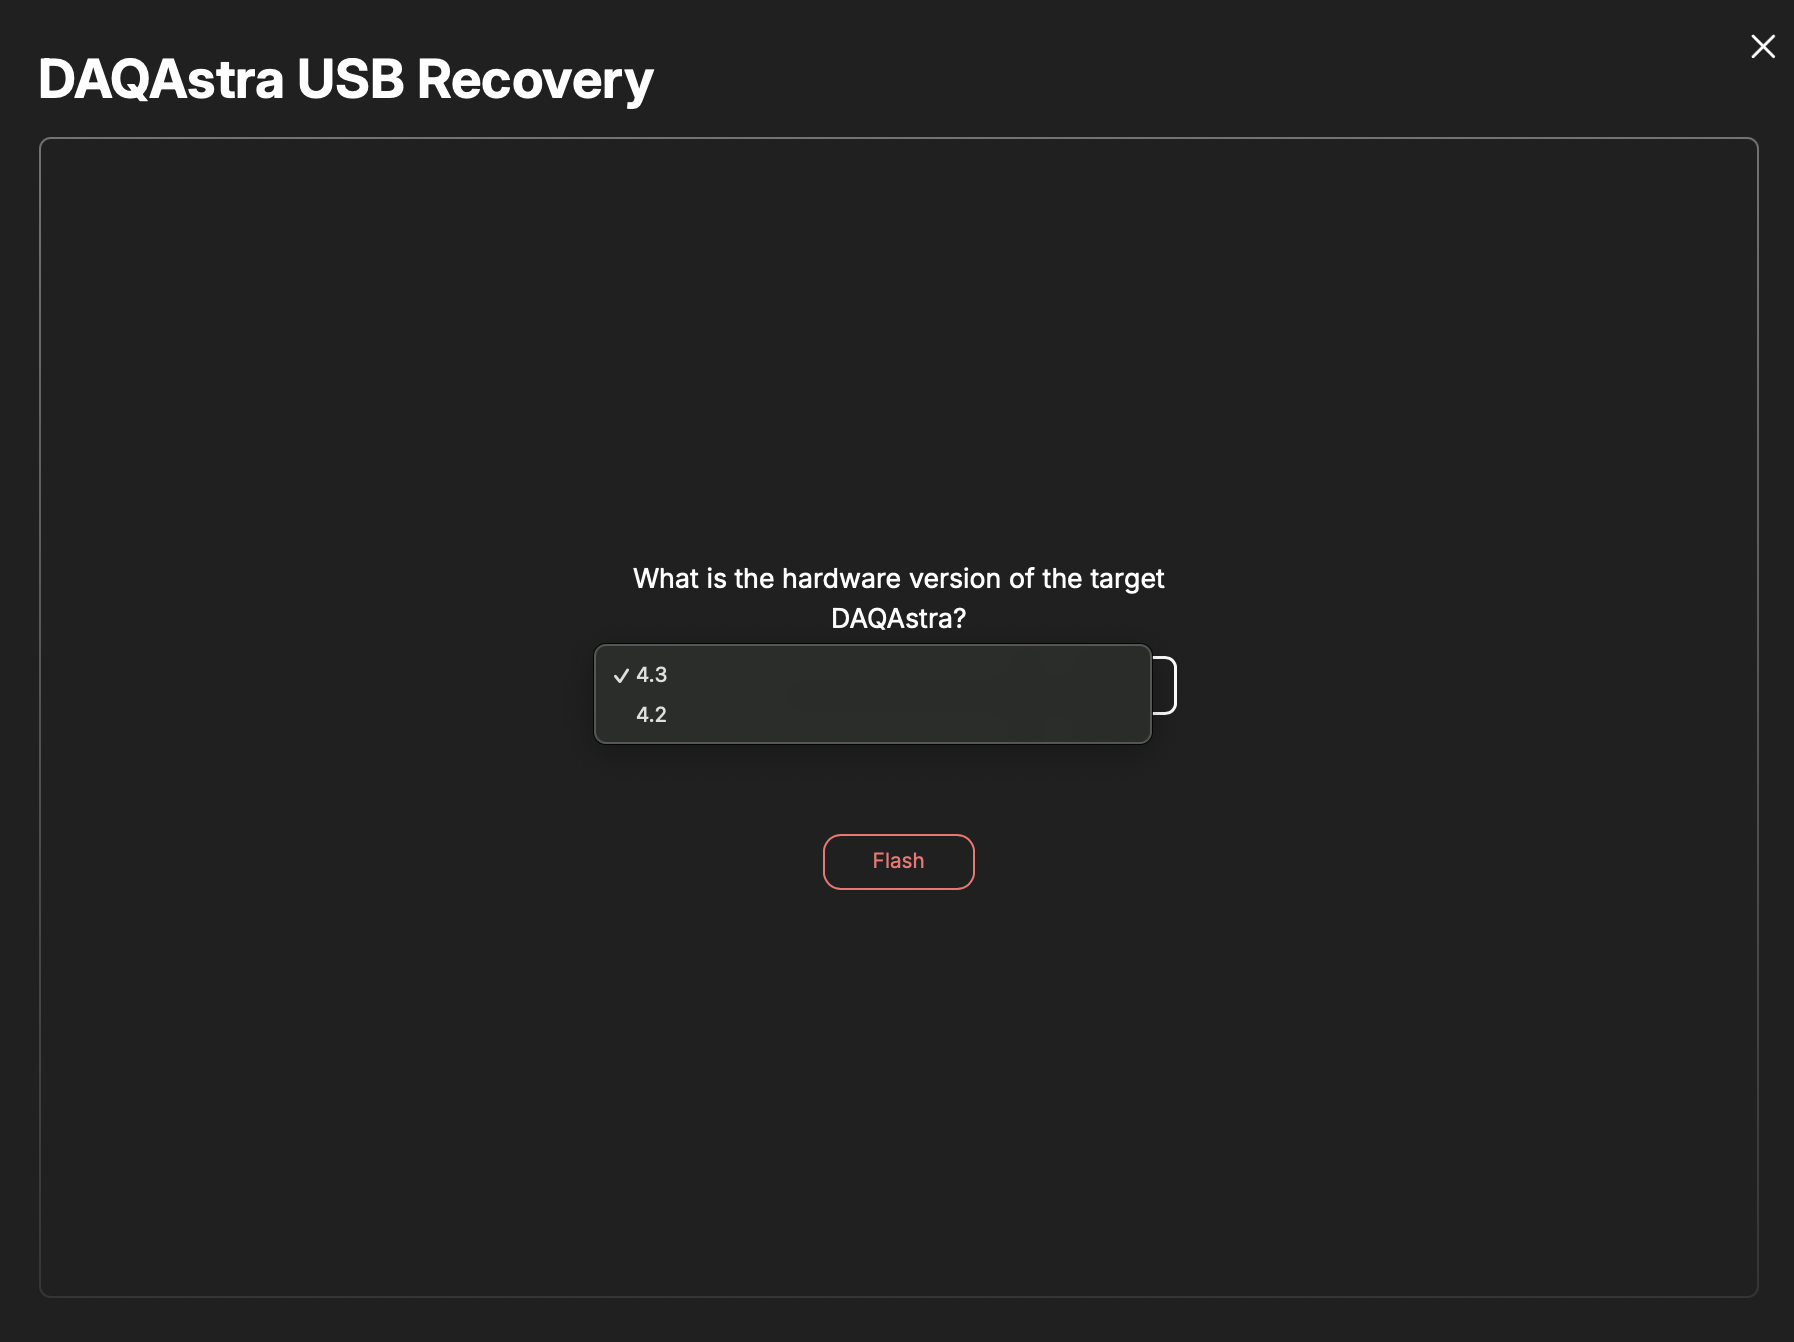
- Finally, press
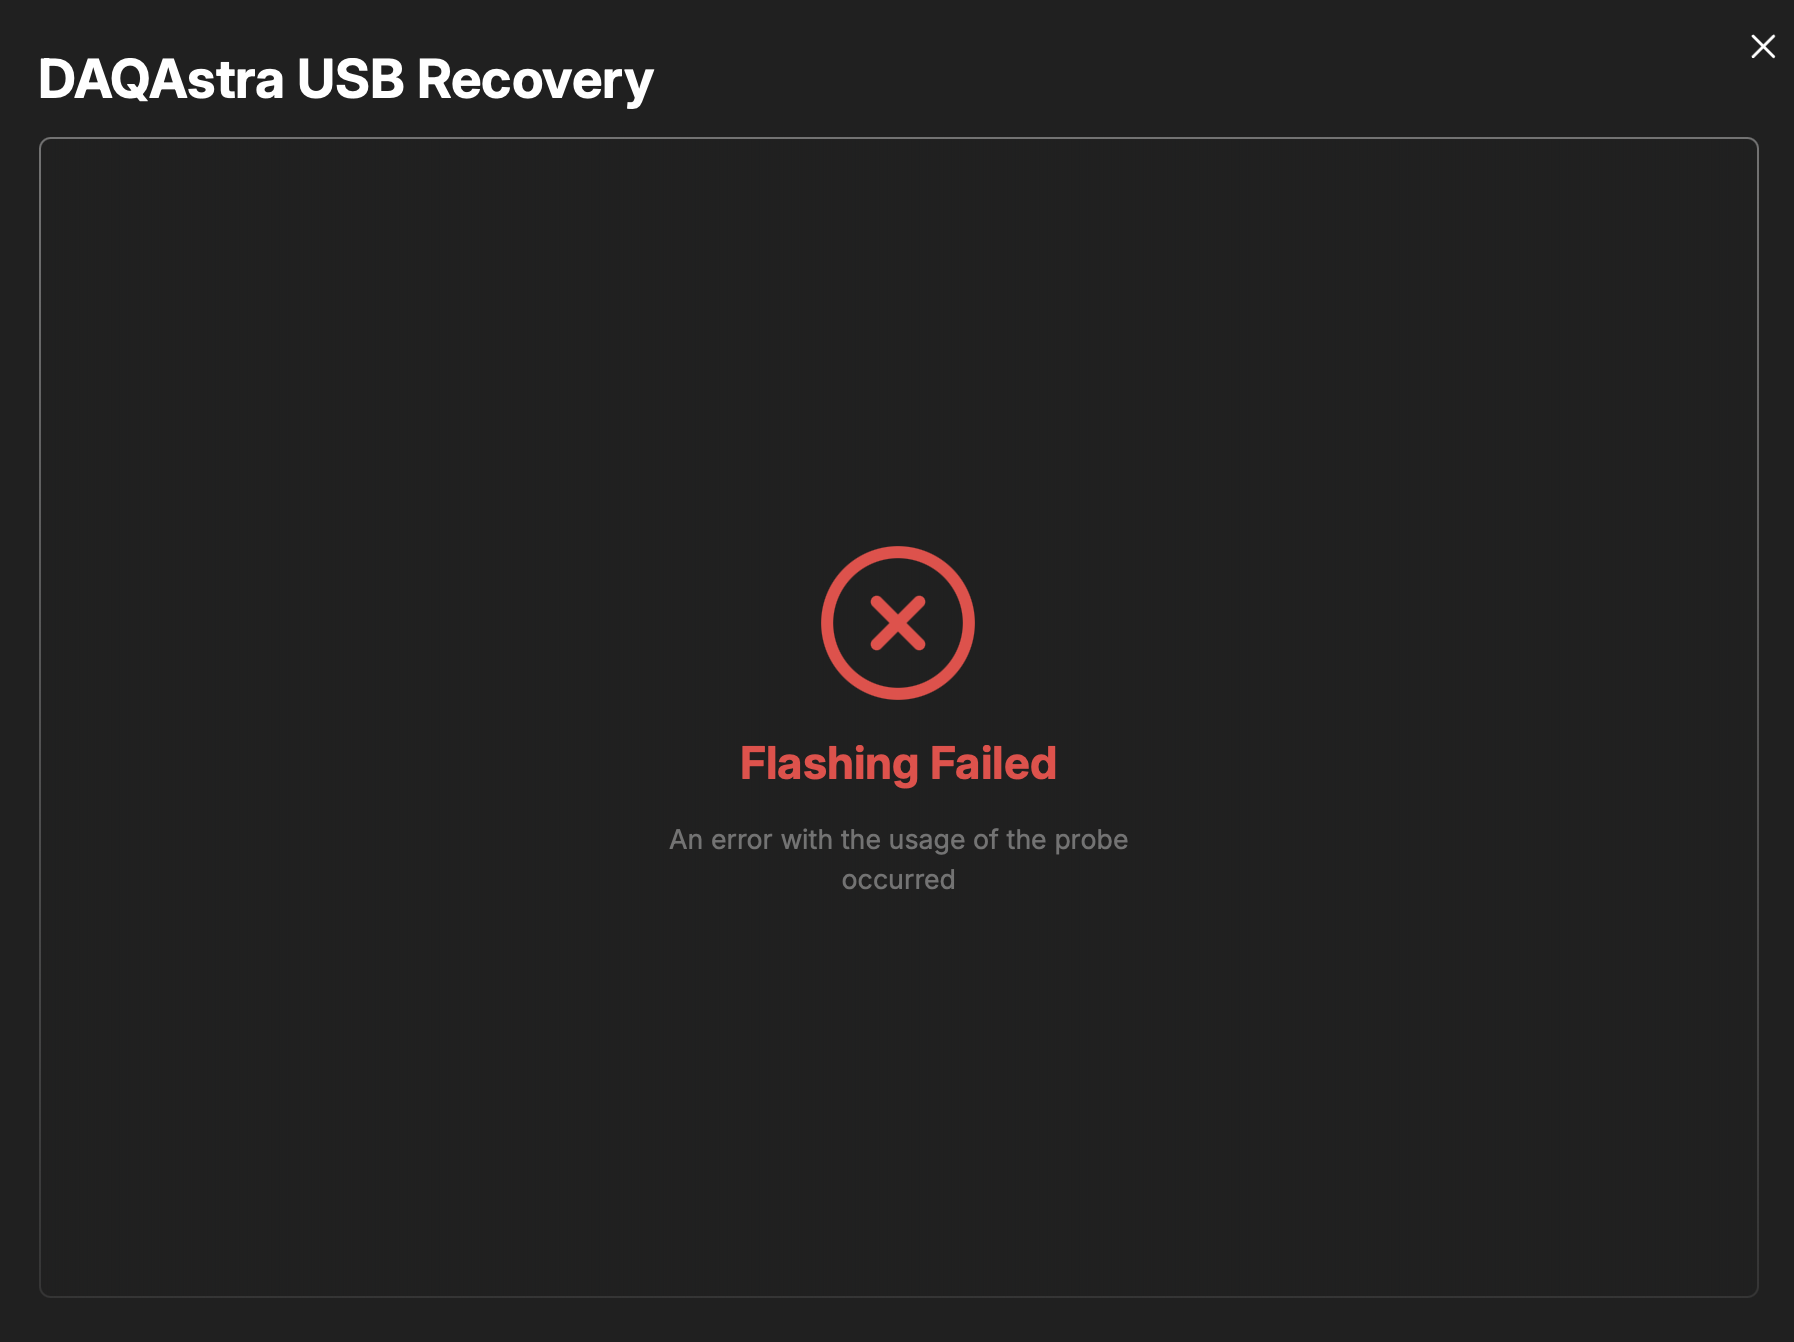
Flashand wait until the result page opens.
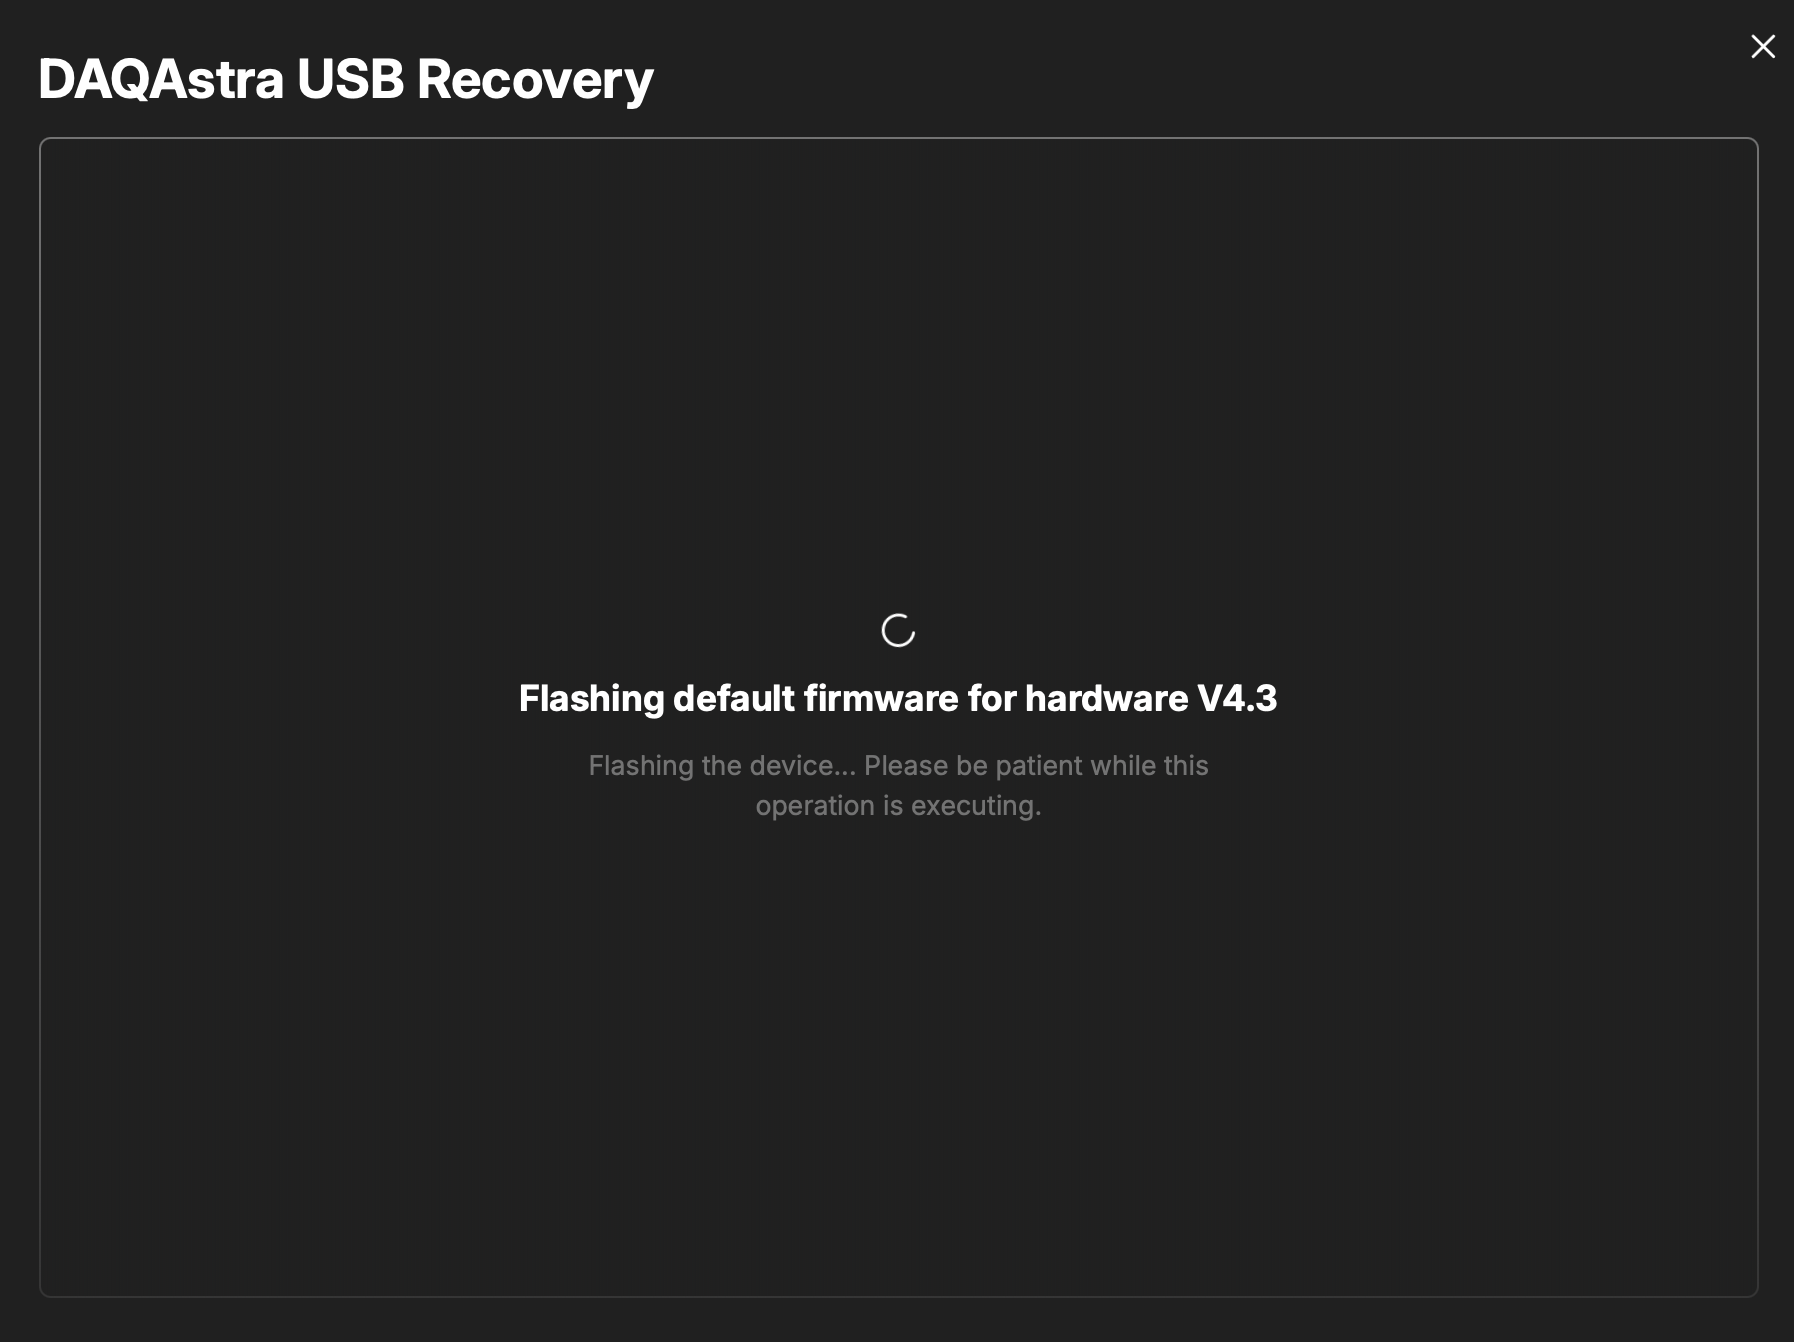
If flashing fails, try navigating back to the point right before pressing
Flash. Press the reboot button on the DAQAstra then clickFlashagain.
- If the firmware update succeeds, you'll see the following page.
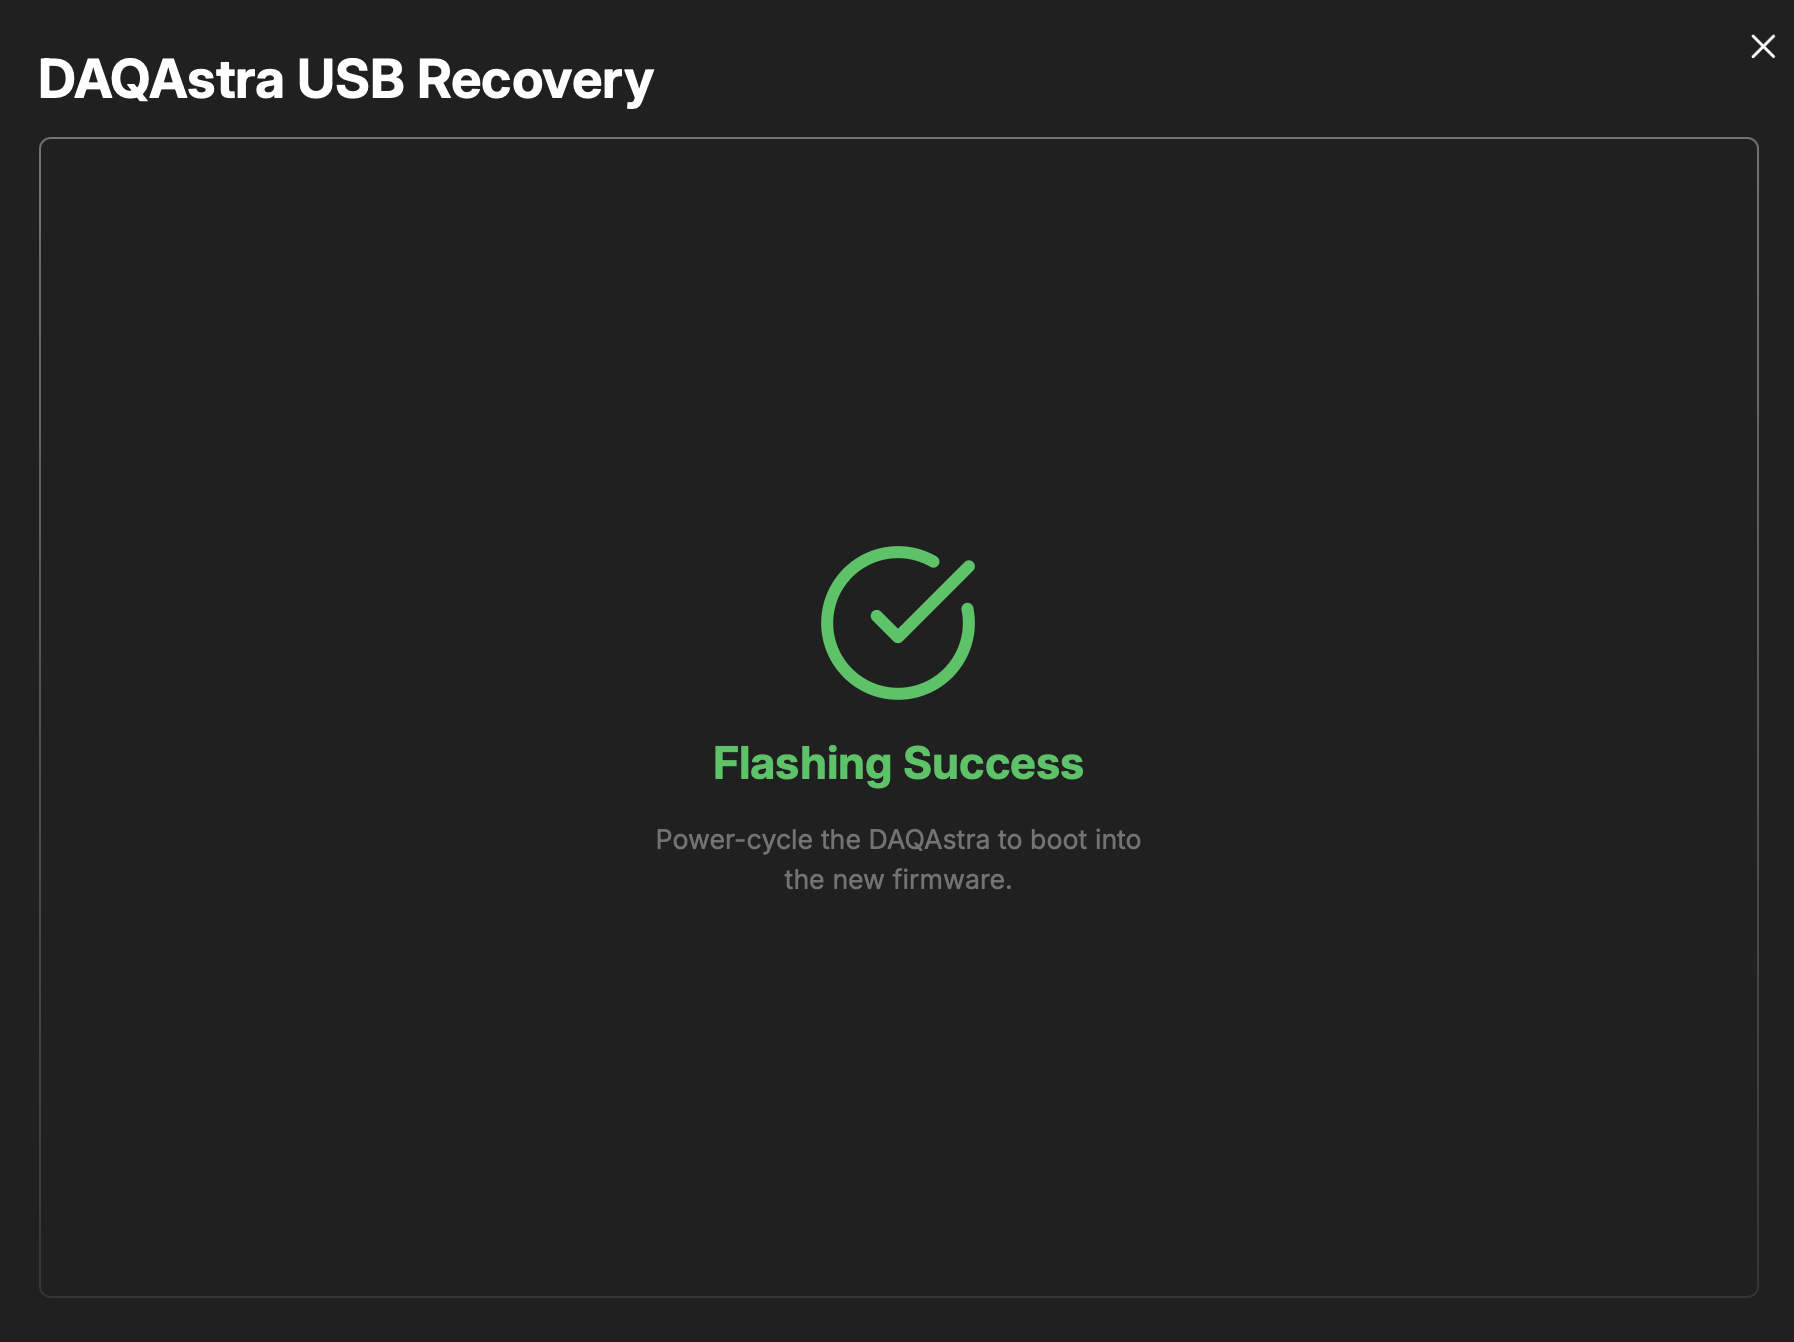
Before removing the STLink probe and replacing the lid of the enclosure, verify the DAQAstra connects to your application.
-
Plug in the ethernet cable into the DAQAstra and the network on which the application is running (whether it be a switch for your LAN with DHCP or via Link-Local).
-
After some time, the Blue LED on the DAQAstra should turn off, indicating a connection to the host application, and a new device should appear under
Factoryin theDevice Pool.
Finally, remove power and unplug the STLink probe from the DAQAstra. Replace the enclosure lid and you may now proceed to use the DAQAstra as you see fit.
If no connection occurs, verify your network setup against the guidelines in
Connecting DAQAstra. If everything checks out, reach out to any of the following engineers at TransAstra for support.
Operations
This section will cover the nominal usage of the DAQAstra application's interface and will give an overview and resources for learning about the open-source software that is used to support DAQAstra. Namely, InfluxDB for data storage and Node-Red for data visualization and more.
DAQAstra Application Demo
In this demo, you will be guided through the initial steps of setting up firmware, adding services, releasing firmware to a DAQAstra board, and deploying updates. We will begin on the Devices Page by creating a new firmware. If you’d like more details about firmware, its components, and how to navigate the interface, please visit the Firmware Interface.
Once the user has created a new firmware and navigated to the corresponding page, they will see two sections: Pinout and Services. To select the desired services, the user must click the '+' icon. For more information on the available services and how to define them, please visit the Service Interface.
As services are added and pins are defined, the Pinout section will highlight which pins are in use. The selected services will appear under the Services section, where users can edit, delete, or duplicate a service by right-clicking on it. Users can continue adding services as needed until they have fully customized their firmware.
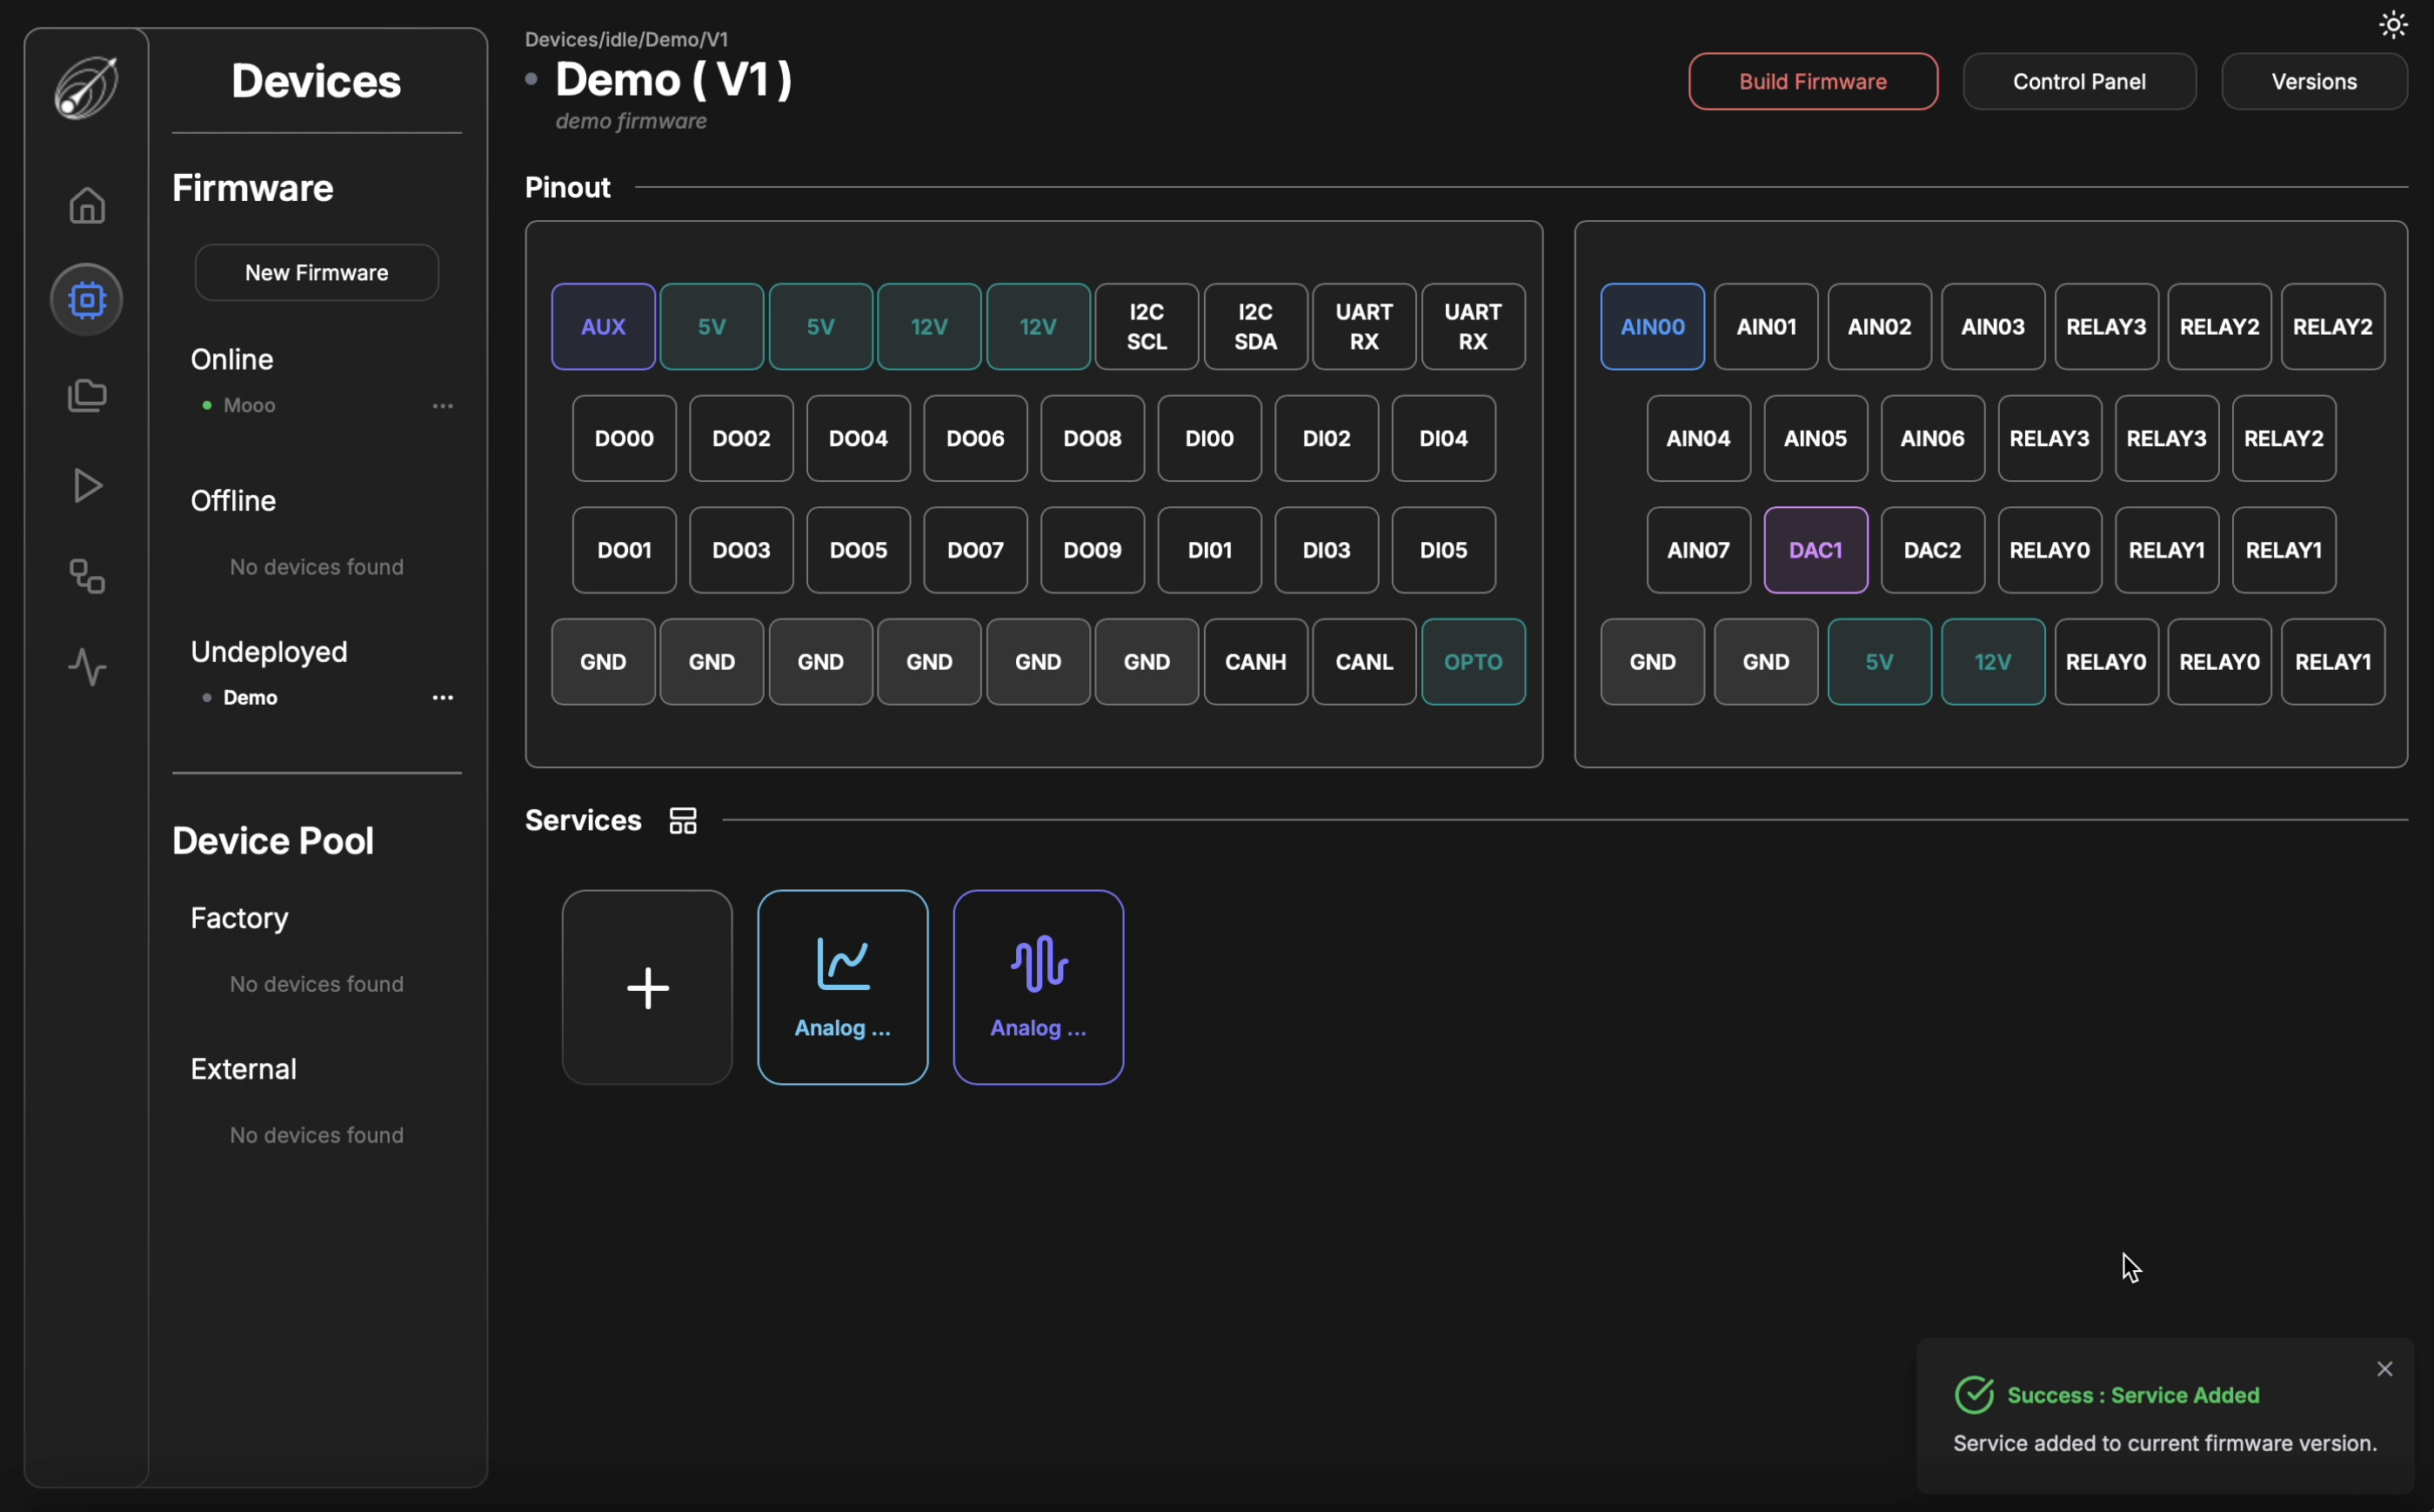
After finalizing the firmware configuration, the user must build it before deploying it to the board.
To do this, they should navigate to the desired firmware on the Devices page. The "Build Firmware" button, outlined in red, is located at the top right of the page.
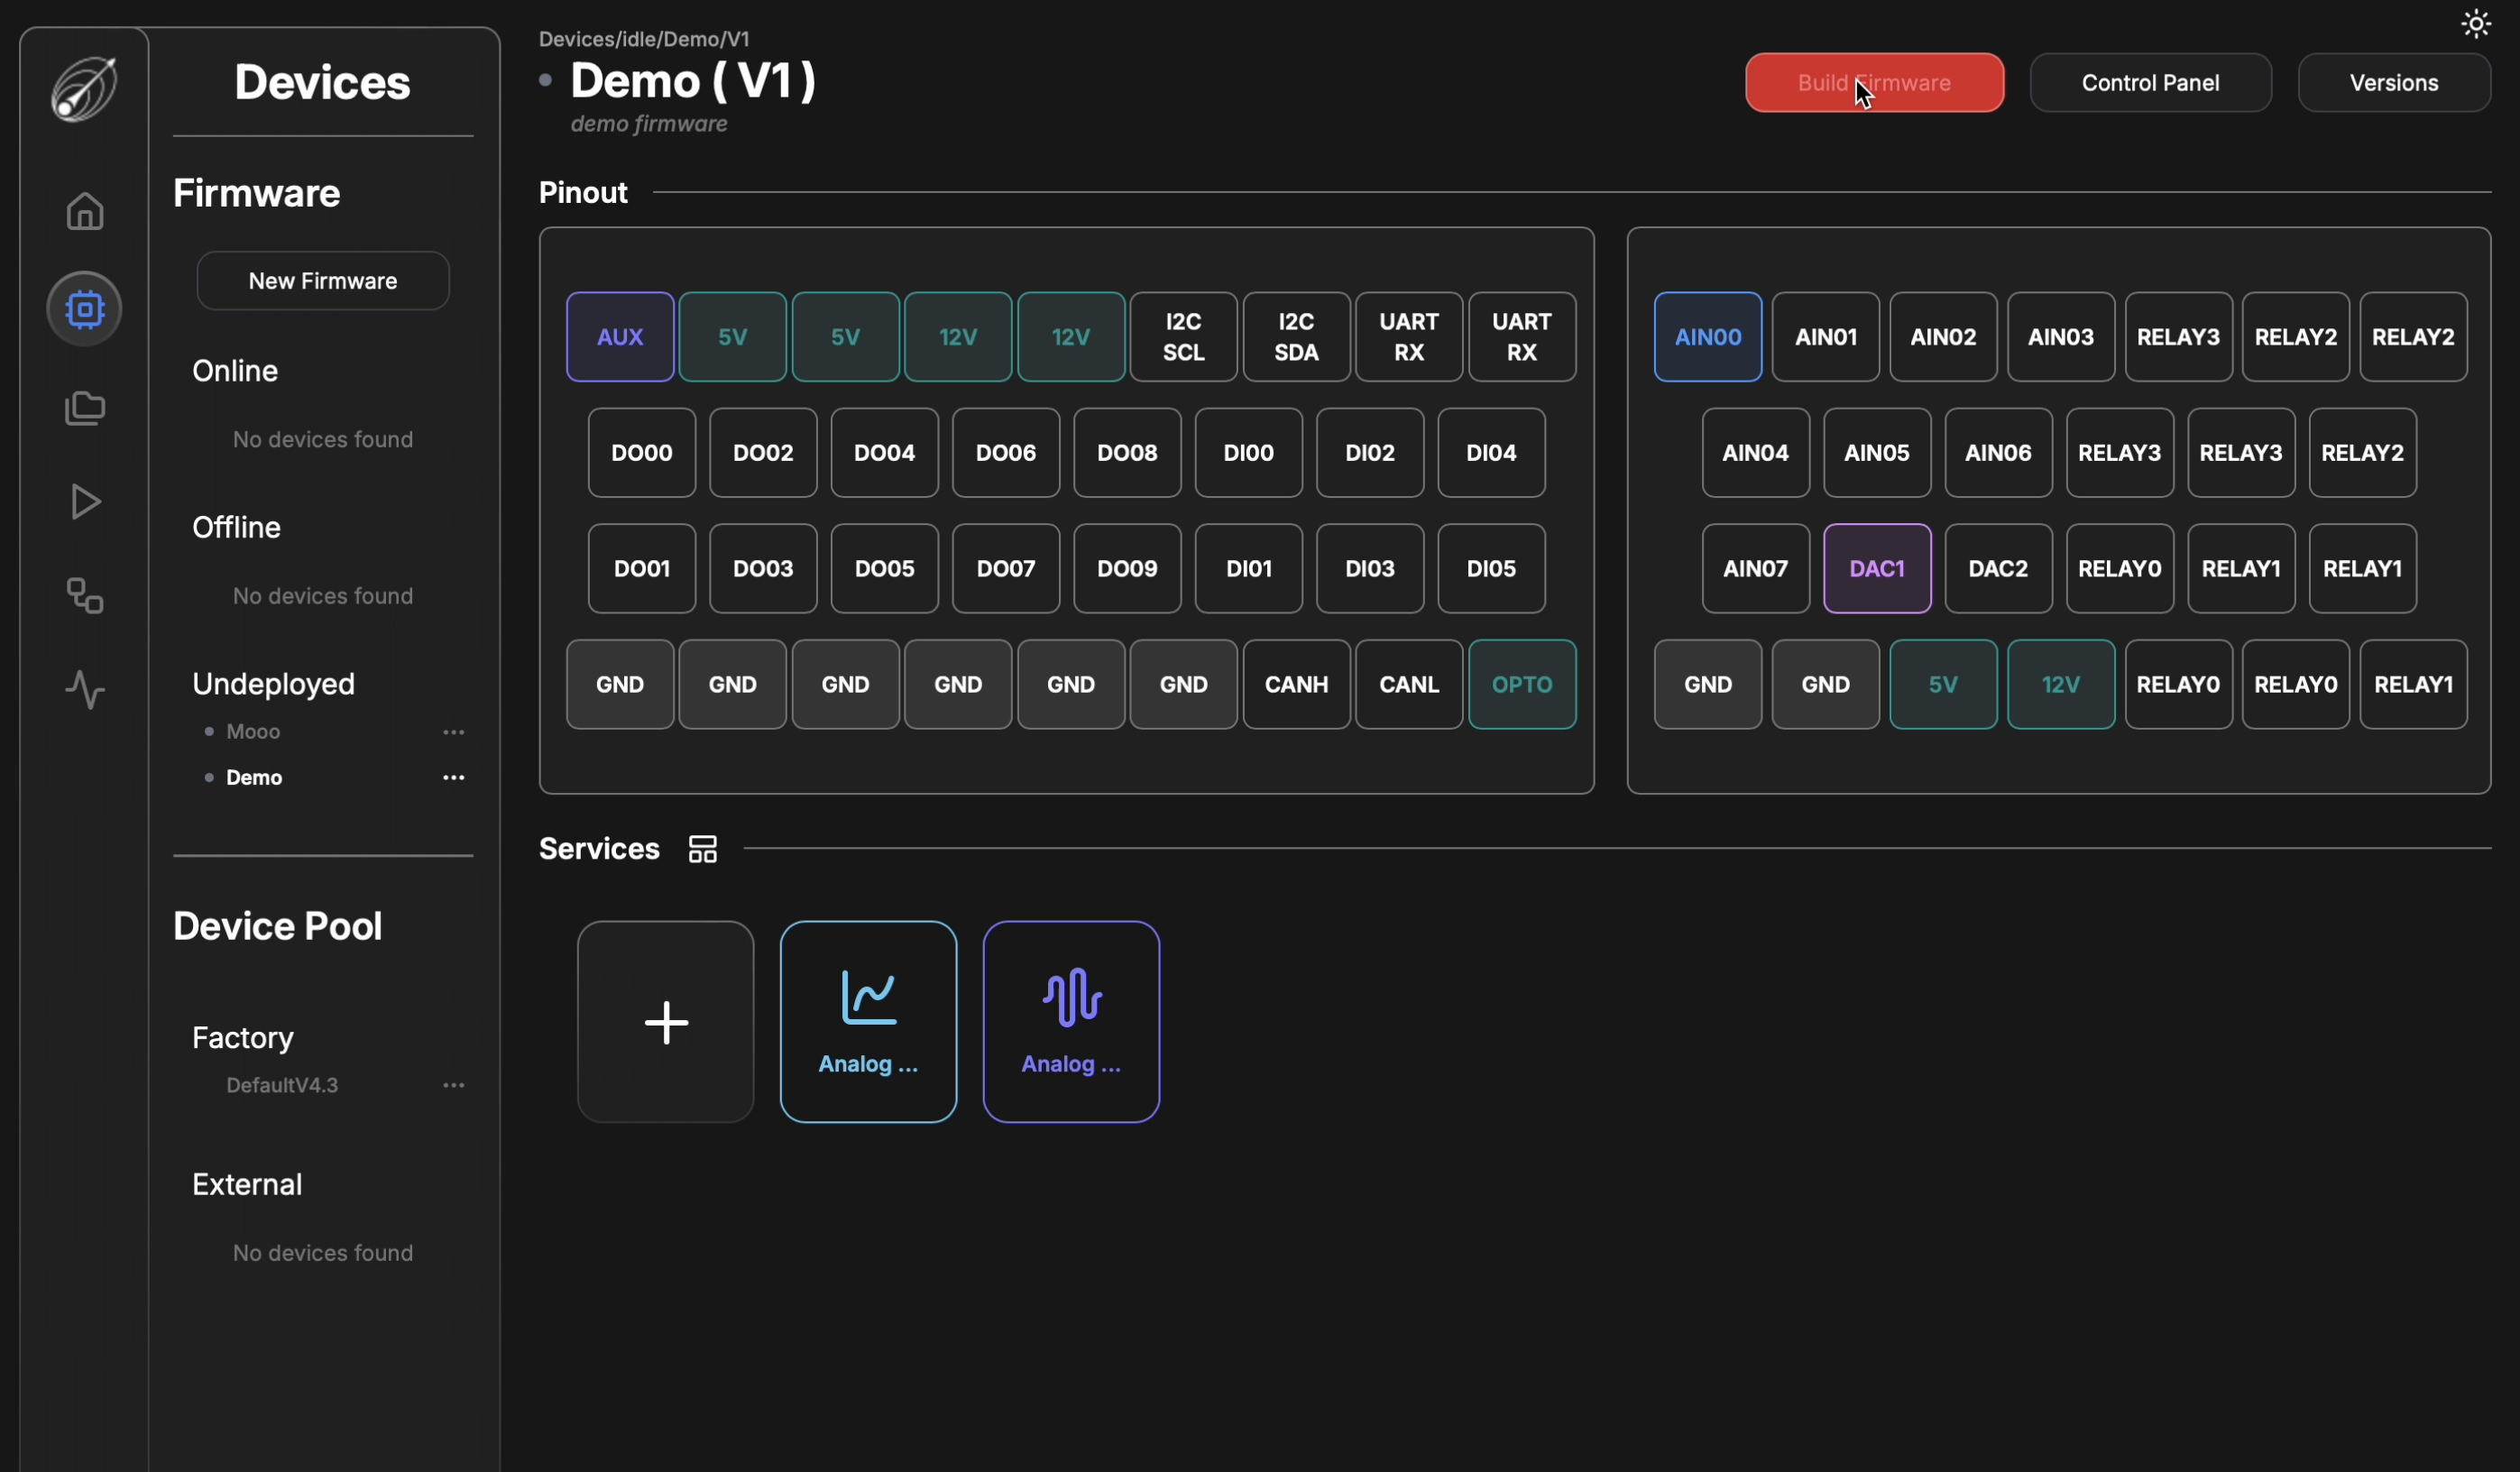
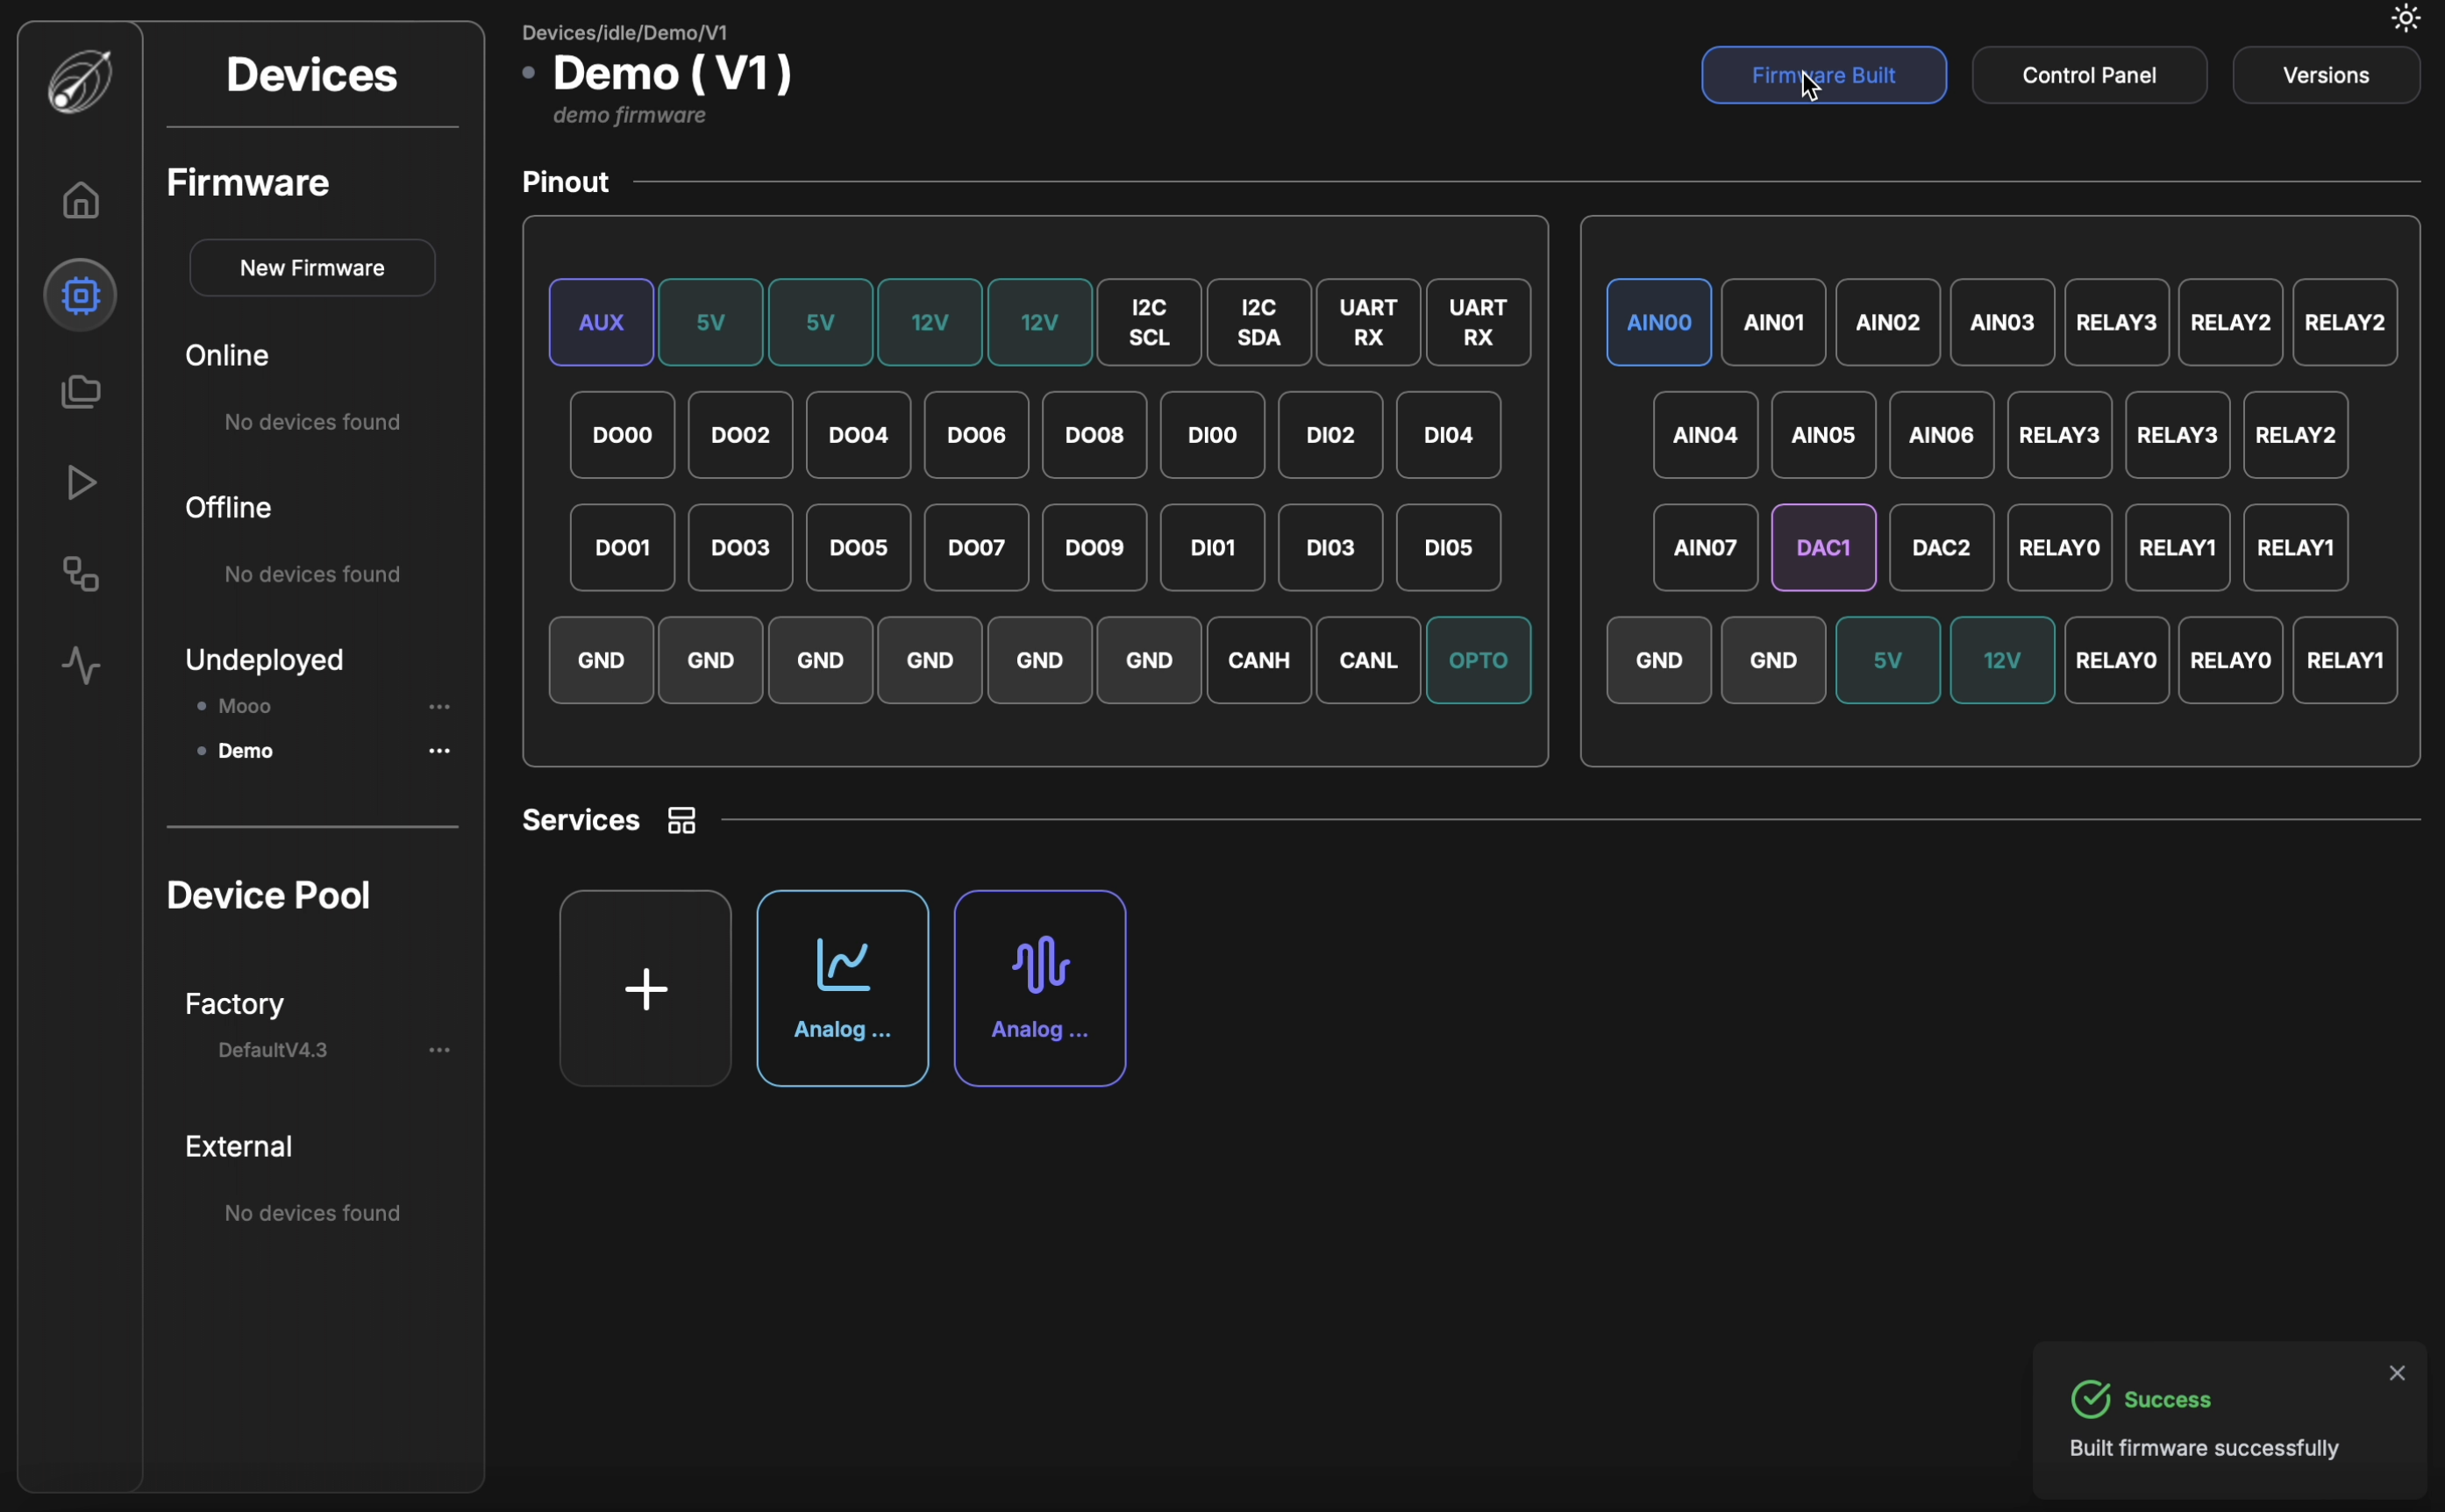
If the firmware has already been built, the "Build Firmware" button will change to "Firmware Built" and be outlined in blue. Whenever the user makes an edit, they must rebuild the firmware to incorporate the updates before redeploying it to the board.
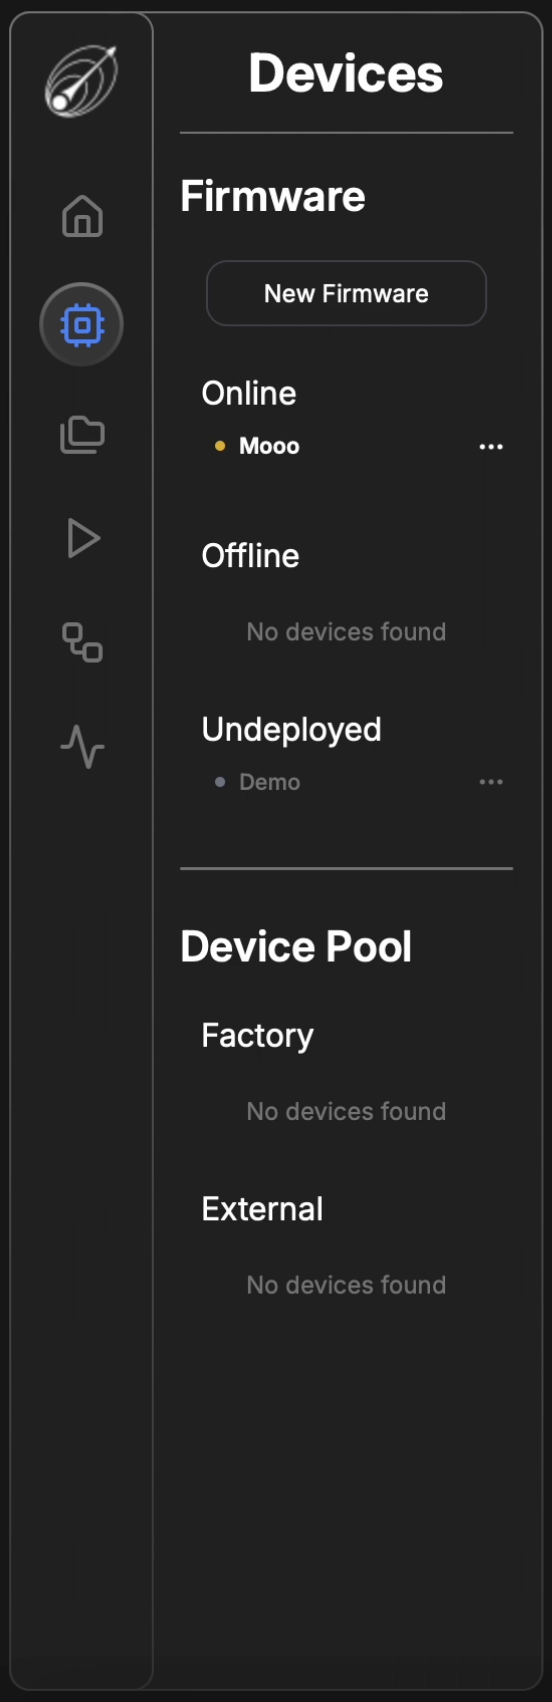
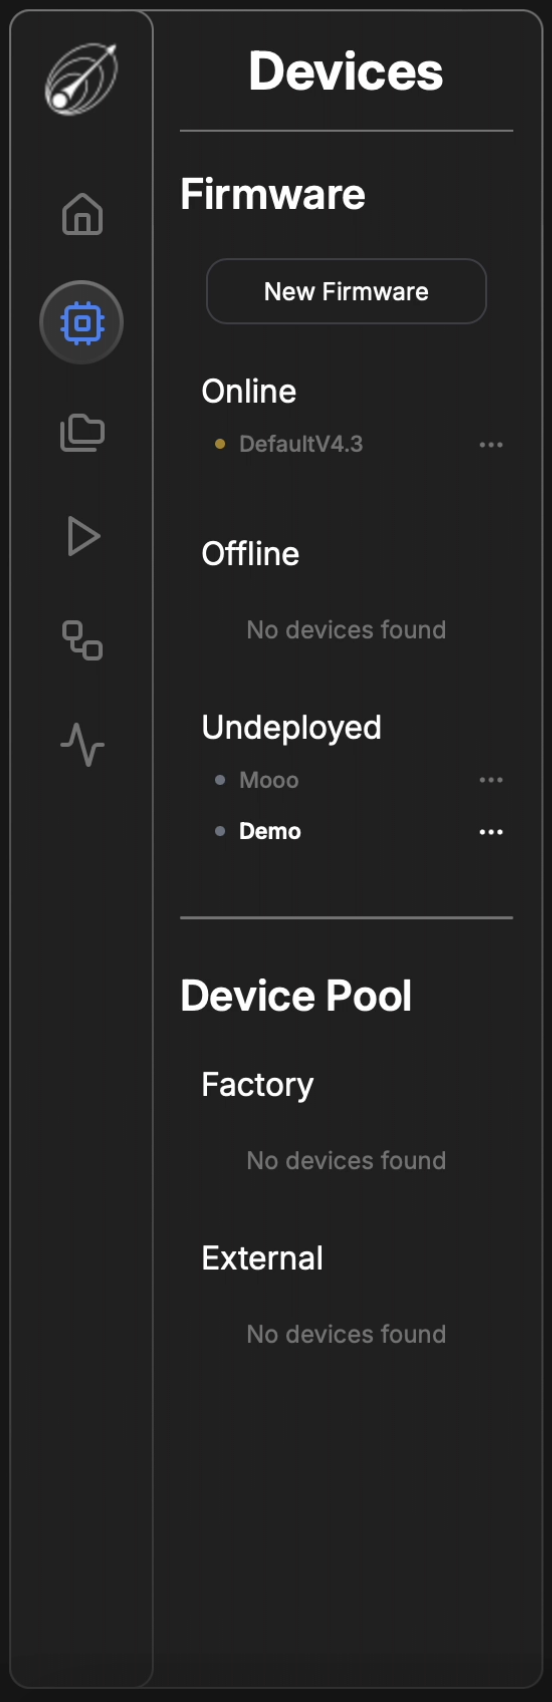
Before deploying their firmware, users must check if a board is available. As shown in the image below, one board is "Online", while no boards are in "Factory". To deploy new firmware, the user must first release the DAQAstra board from its currently installed firmware.
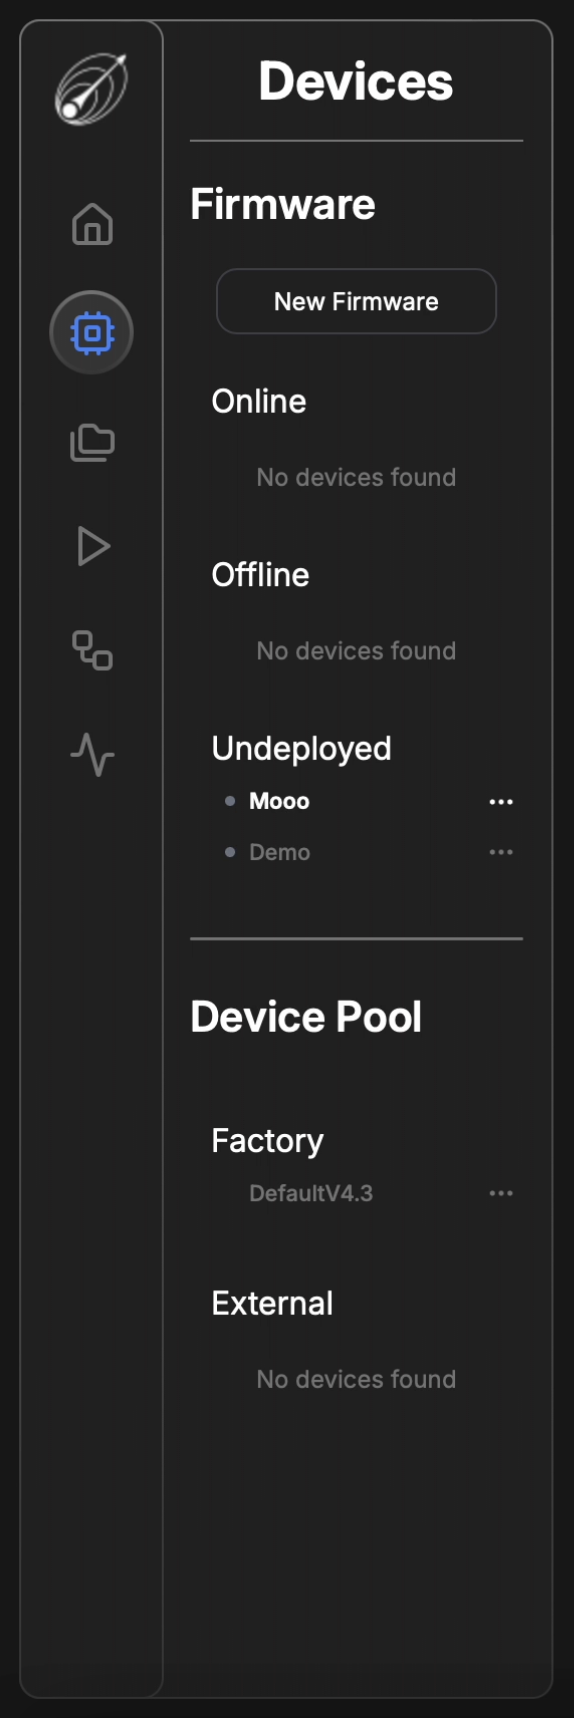
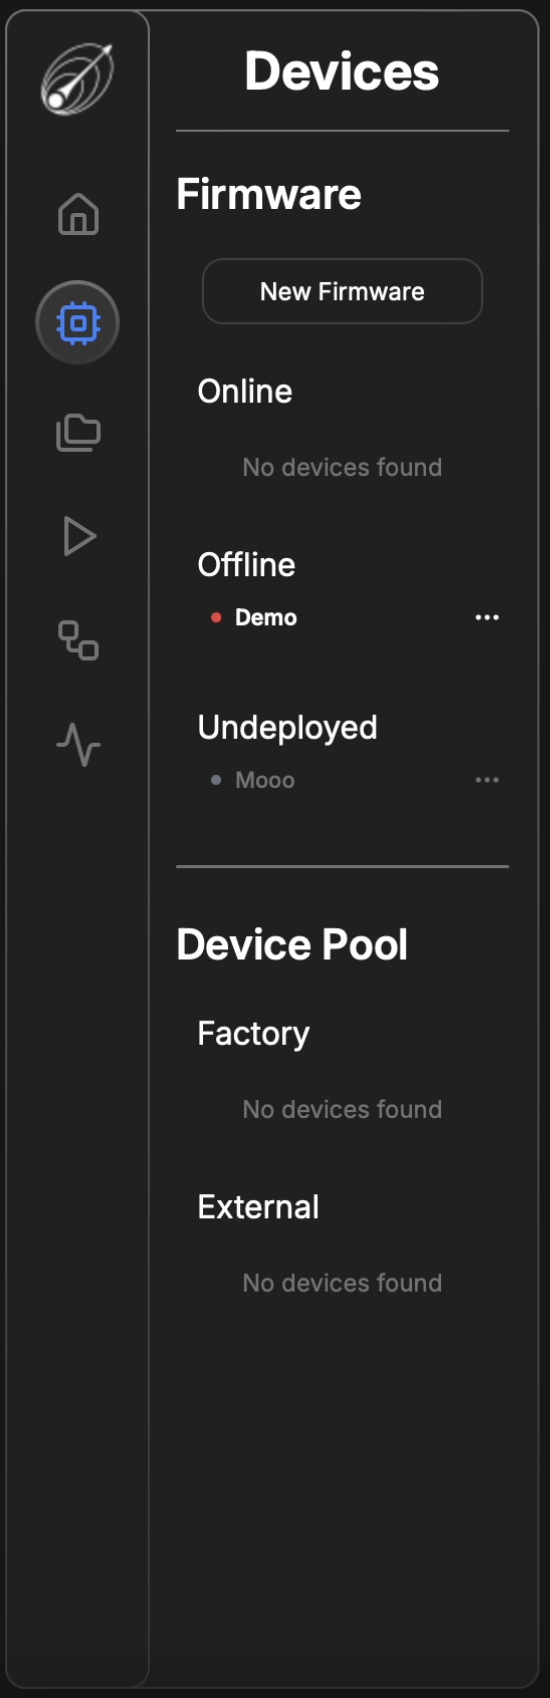
After the user confirms the board release, a blinking yellow circle will appear next to the specified firmware. This indicates that the board is in the process of releasing its current firmware. The release process takes a few seconds. Once complete, the DAQAstra board will appear under "Factory" in the Device Pool. A board in Factory means no firmware is deployed on it, making it available for use.
Please wait 30 seconds before adding a new firmware to recently released board.
There are two ways to deploy firmware. The first method is to locate the undeployed firmware in the sidebar and click the three-dot menu. This will open the Firmware Settings menu, where the user can choose to Deploy to Device or Delete the firmware.
The second method is deploying via the Versions button. If the user has multiple firmware versions and wants to deploy a previous version, they can navigate to the Versions button in the top-right corner of the specified firmware. From there, they can select the desired version and click Deploy.
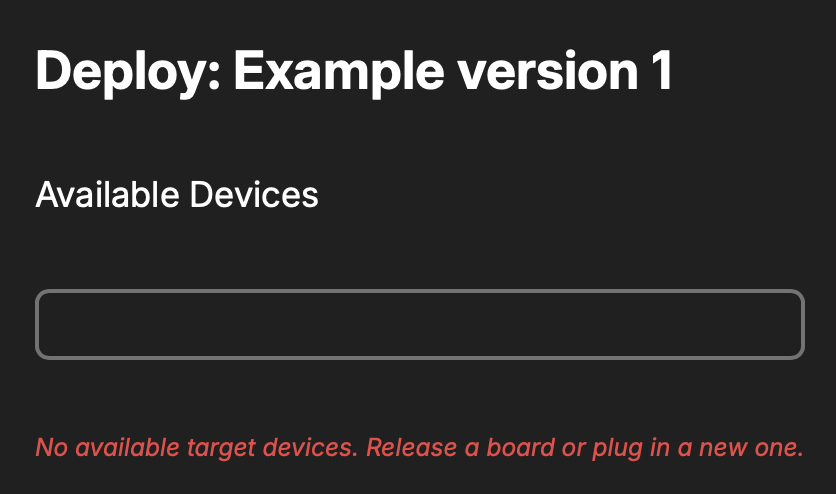
 Once the user selects a deployment method, a modal will appear displaying the available boards.
- If only one board is available, it will be selected by default.
- If multiple boards are available, the user can choose which board to deploy the firmware on.
- If no dropdown appears, it means there are no free connected boards or no connected boards at all.
During the update process, the board will flash yellow as it installs the new firmware. Once the update is complete, the firmware name will appear under Online with a green dot, indicating that the OTA update is finished and the board is ready for use.
Node-Red & Dashboards
Node-Red is a programming tool for wiring together hardware devices, APIs and online services in new and interesting ways. It provides a browser-based editor that makes it easy to wire together flows using the wide range of nodes in the palette that can be deployed to its runtime in a single-click.
The DAQAstra application provides a service called FlowGen, which generates Node-Red flows for the user-defined firmware. These flows will provide an out-of-the box dashboard interface to view realtime data and send commands to a DAQAstra. For most use cases, the shipped flows are sufficient, giving the user a zero-code interface to the services on the DAQAstra.
However, Node-Red, is an open-source tool that gives the user the power to extend the service interfaces to their needs. Whether a DAQAstra's control output must be made to react to another LAN connected machine's data, automation is desired, or emergency cut-offs need to be implemented, Node-Red coupled with FlowGen makes accomplishing these requirements easier than ever.
To get a glimpse of the possibilities available, take a look at the sheer number of nodes that are available in the Node-Red ecosystem.
Using FlowGen
Once a firmware has been defined in the DAQAstra interface, one can generate and deploy a control panel for that firmware using the button highlighed in the image below.
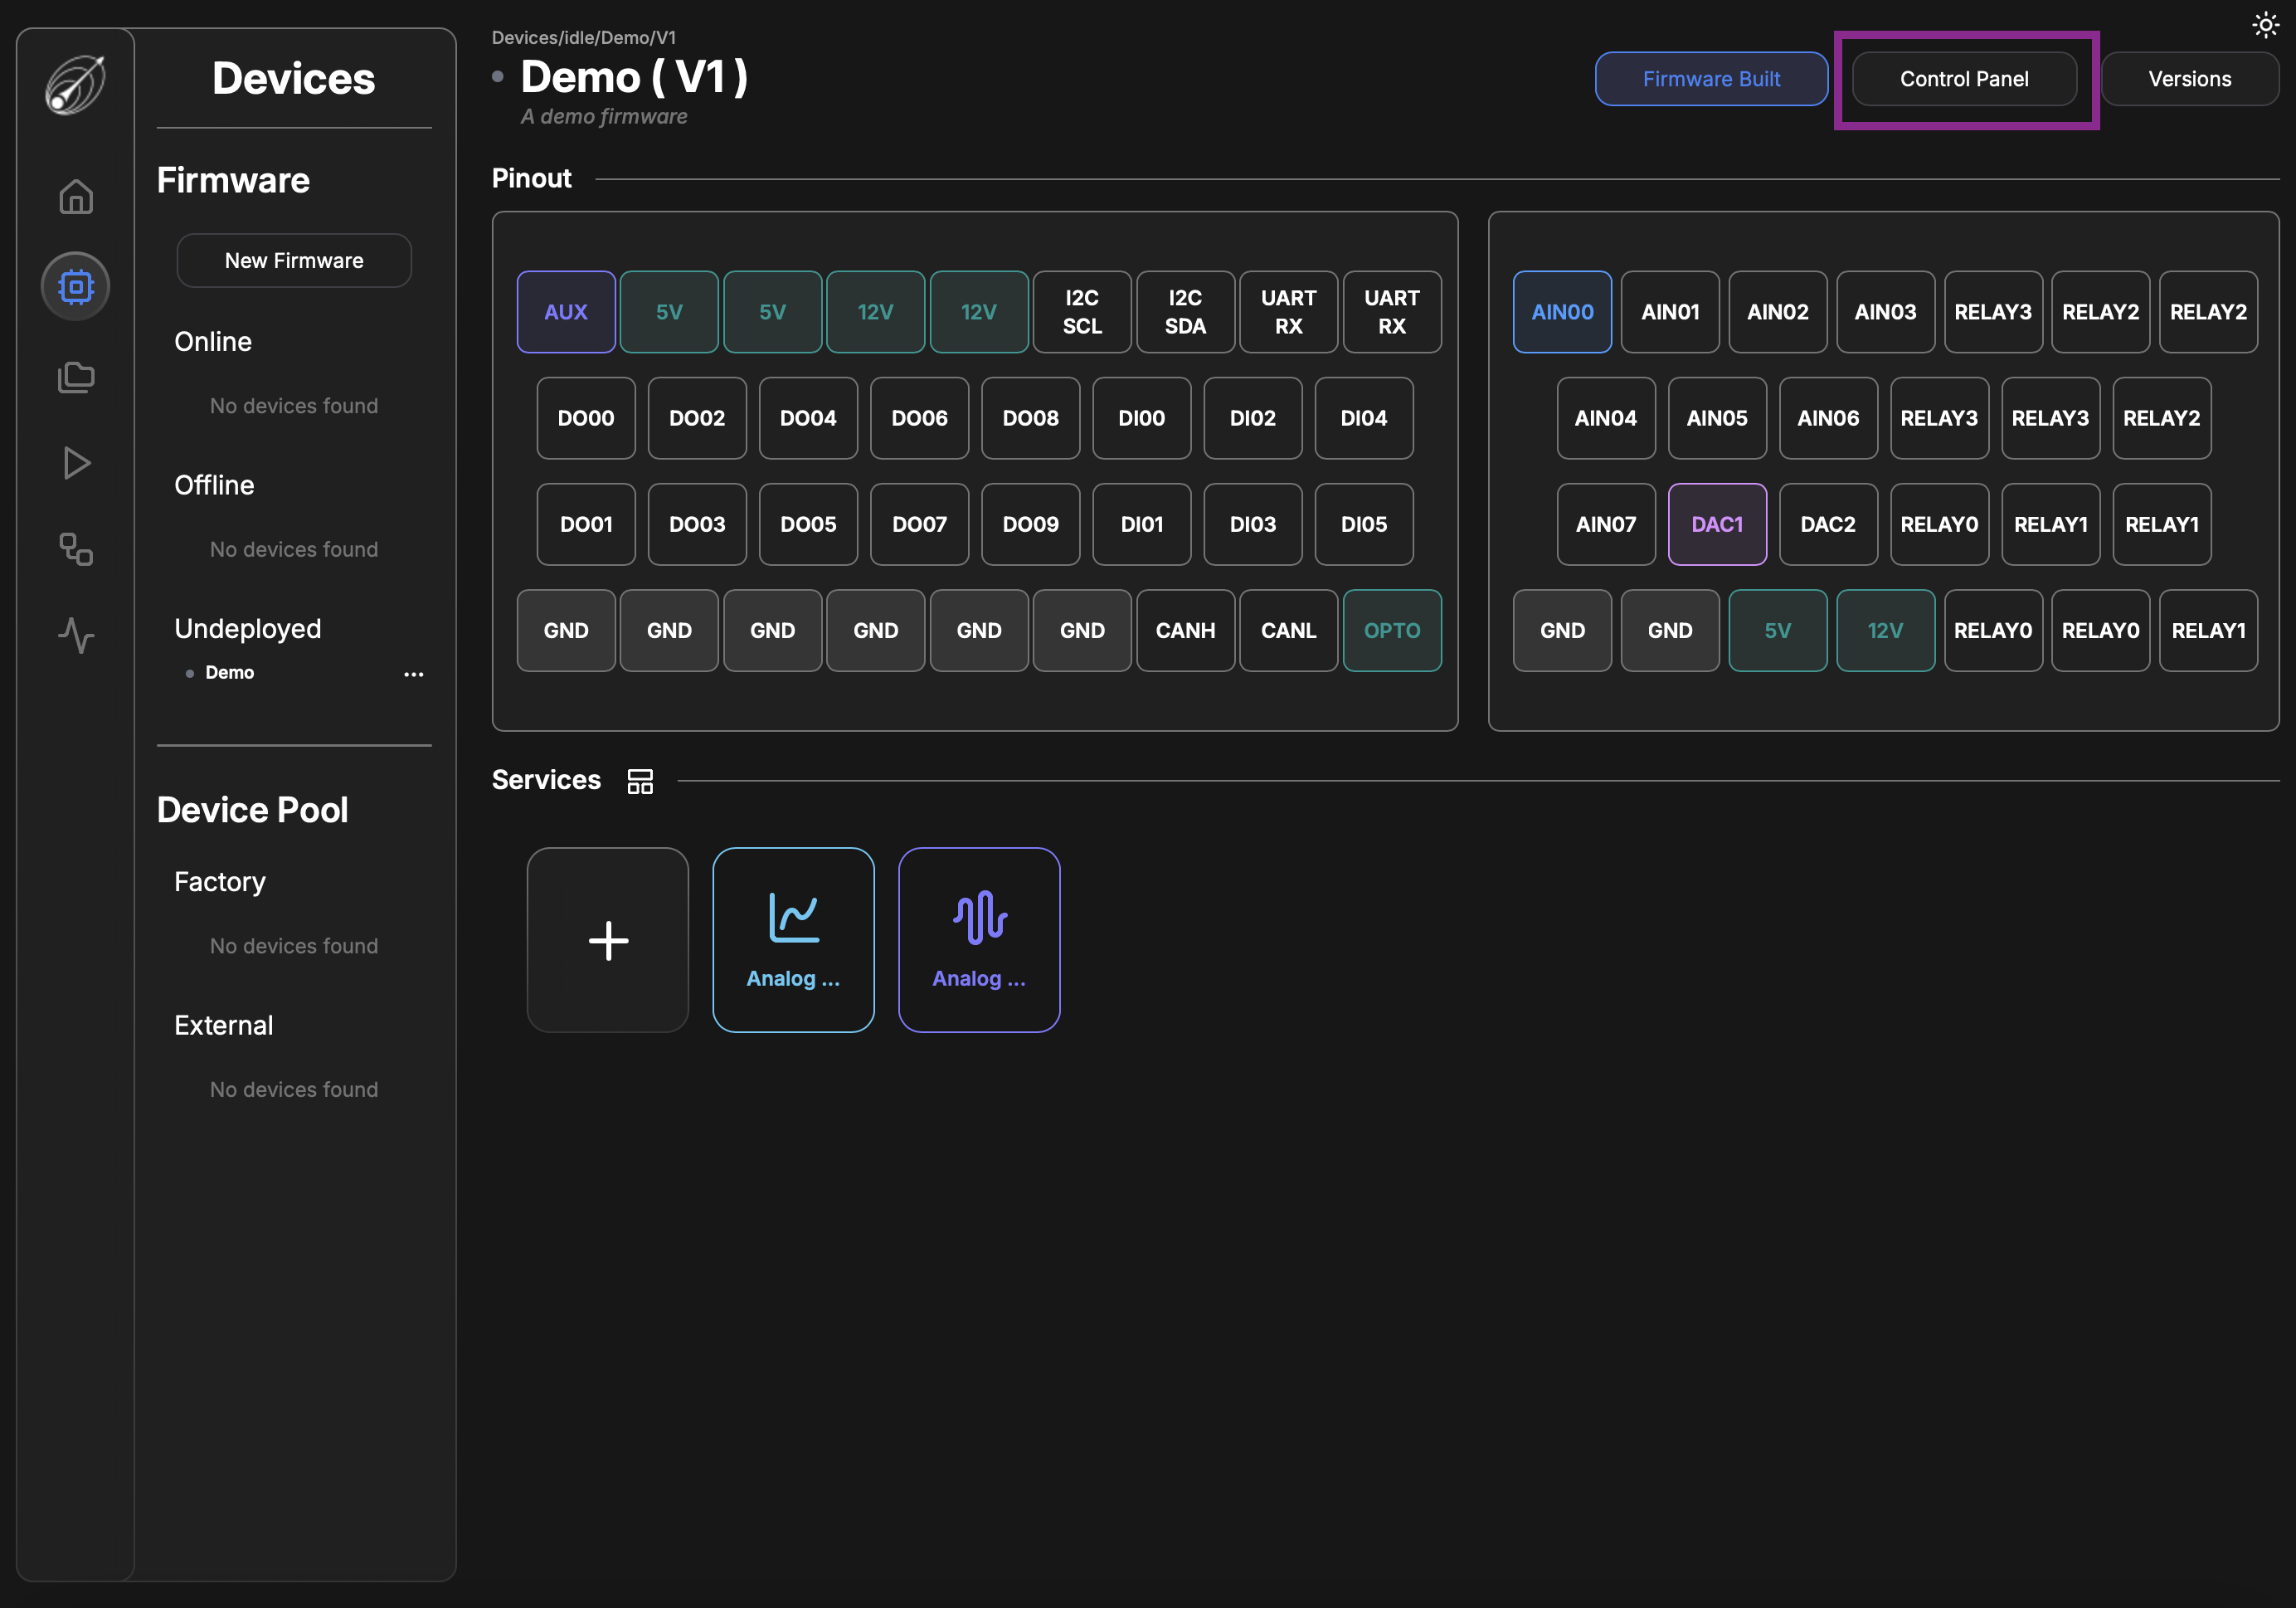
This button deploys a set of Node-Red nodes that allow the user to interface with the defined services on the DAQAstra.
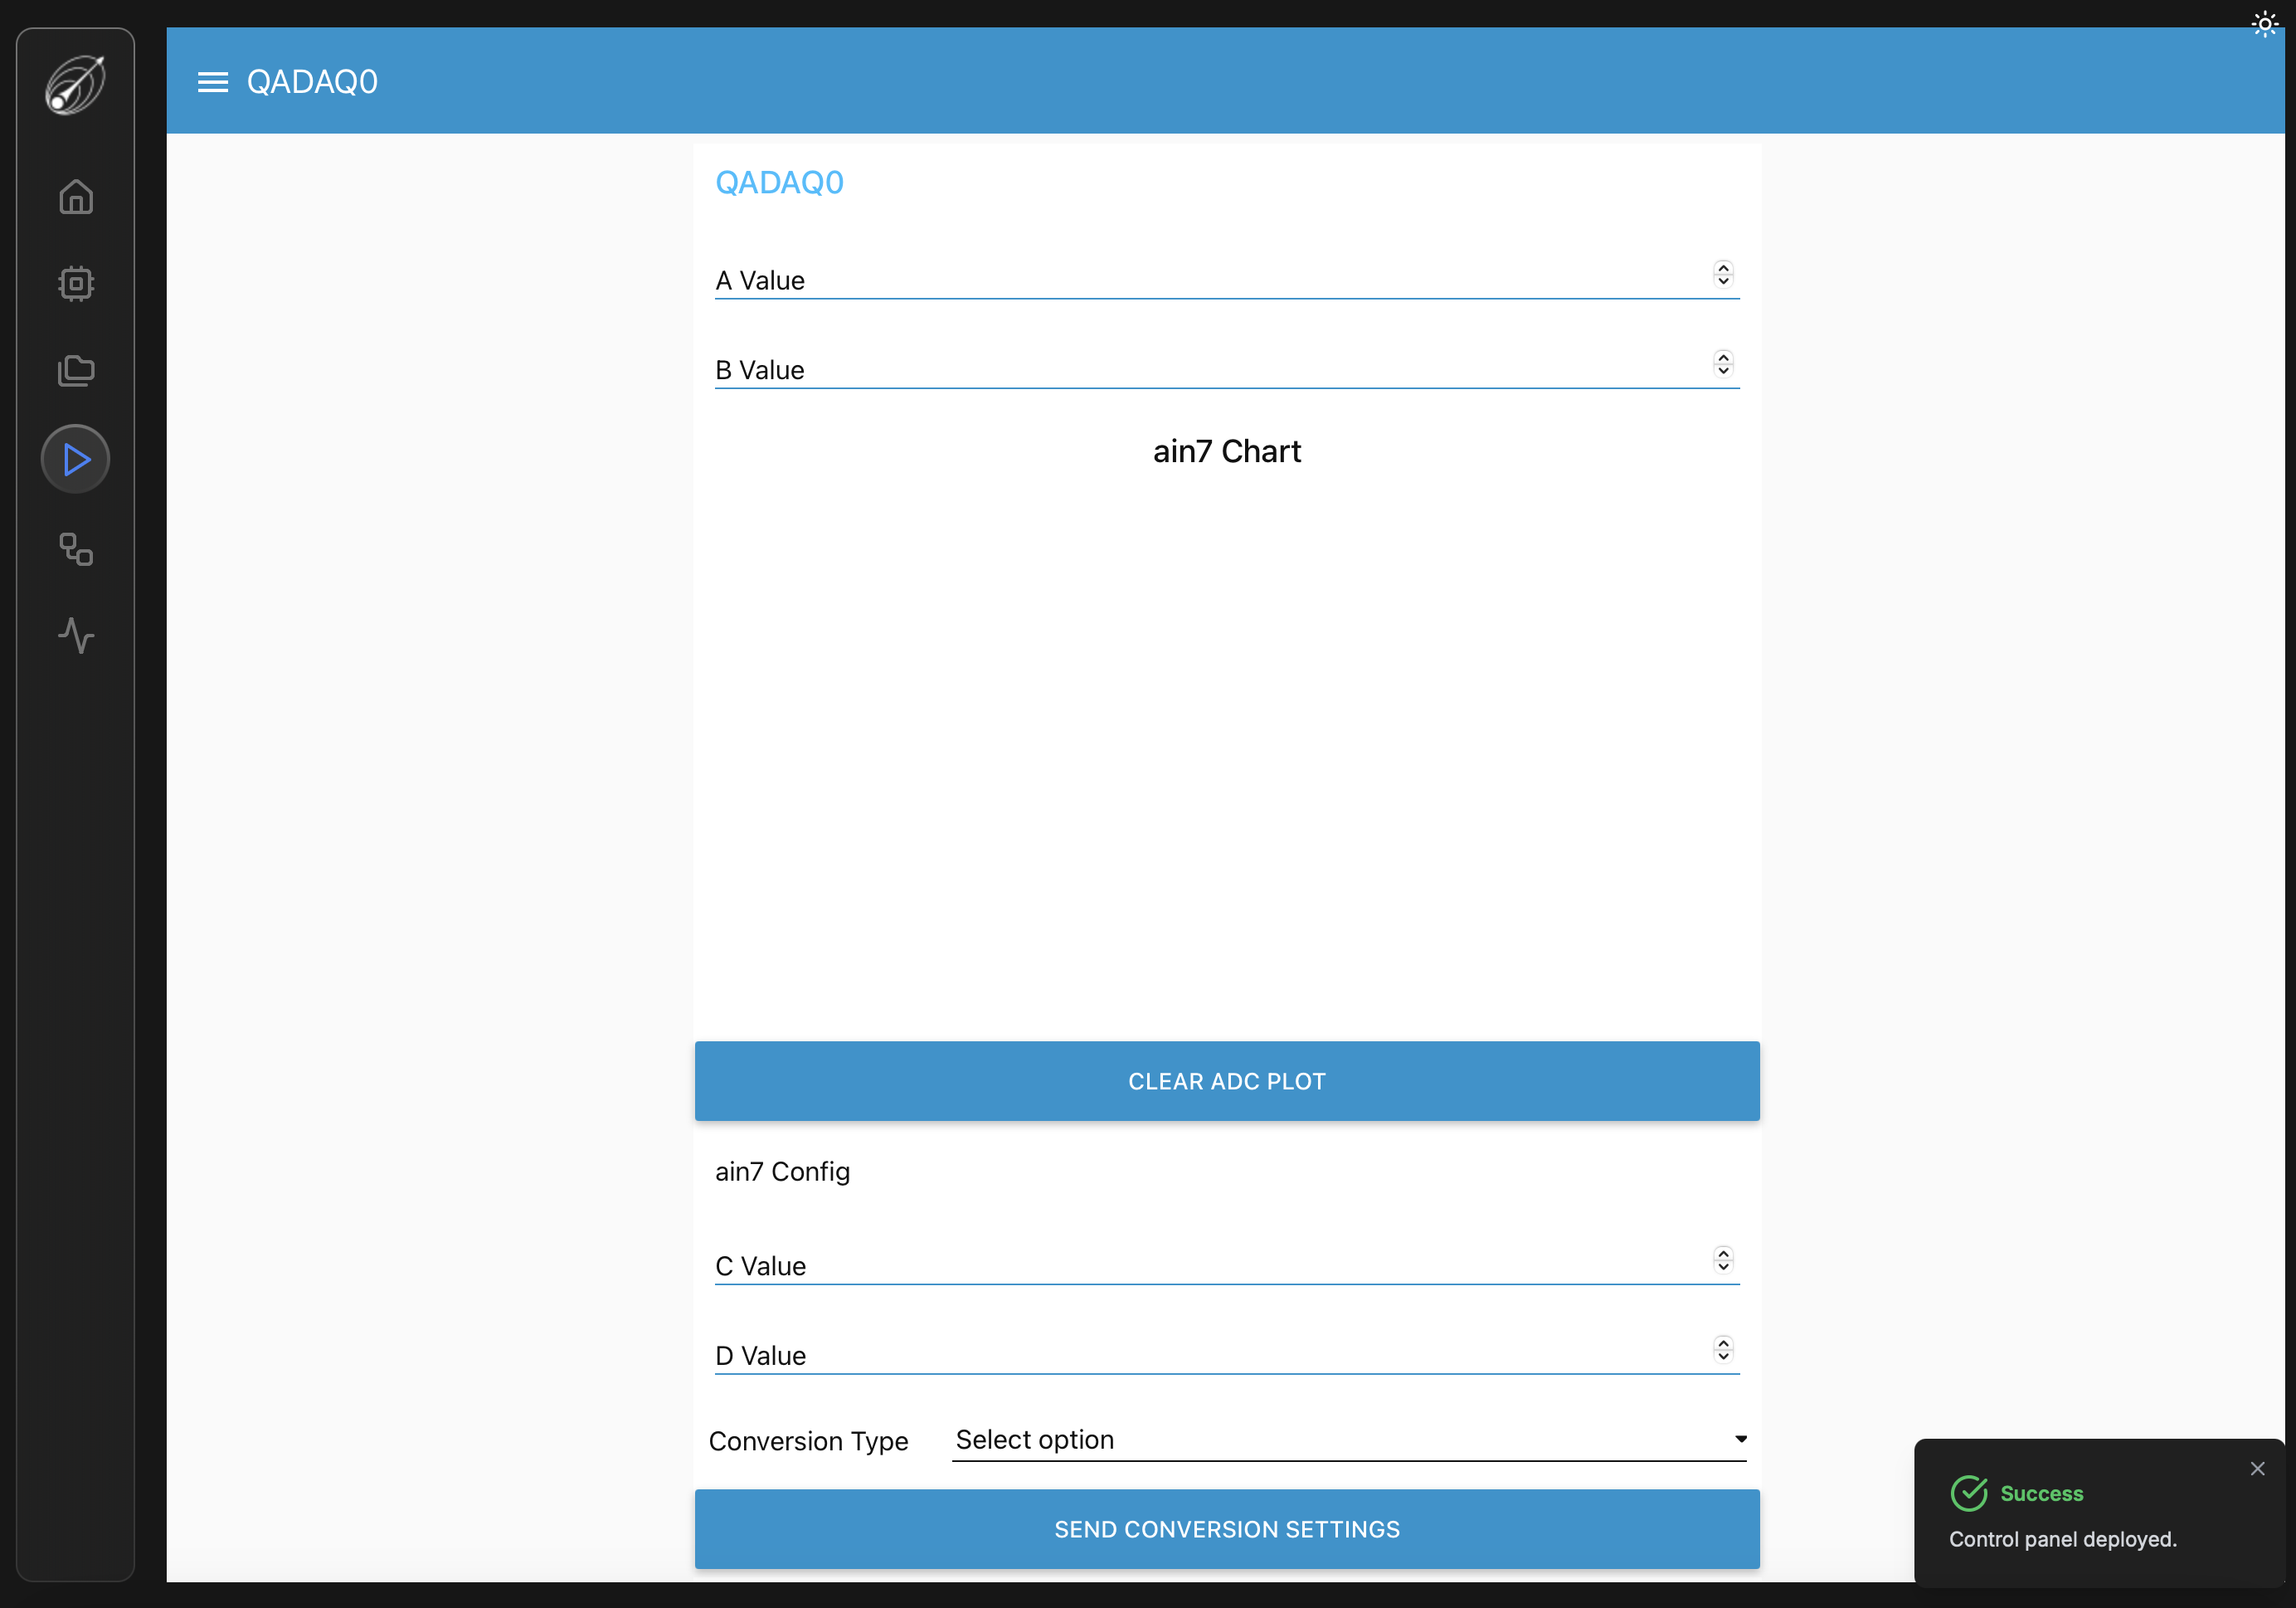
Note that every click of the button deploys a new control panel! So once it has been generated, navigate to it, instead, using the 'Run' page (Play button on the left sidebar).
However, the user will want to generate a new control panel once a firmware has its services changed.
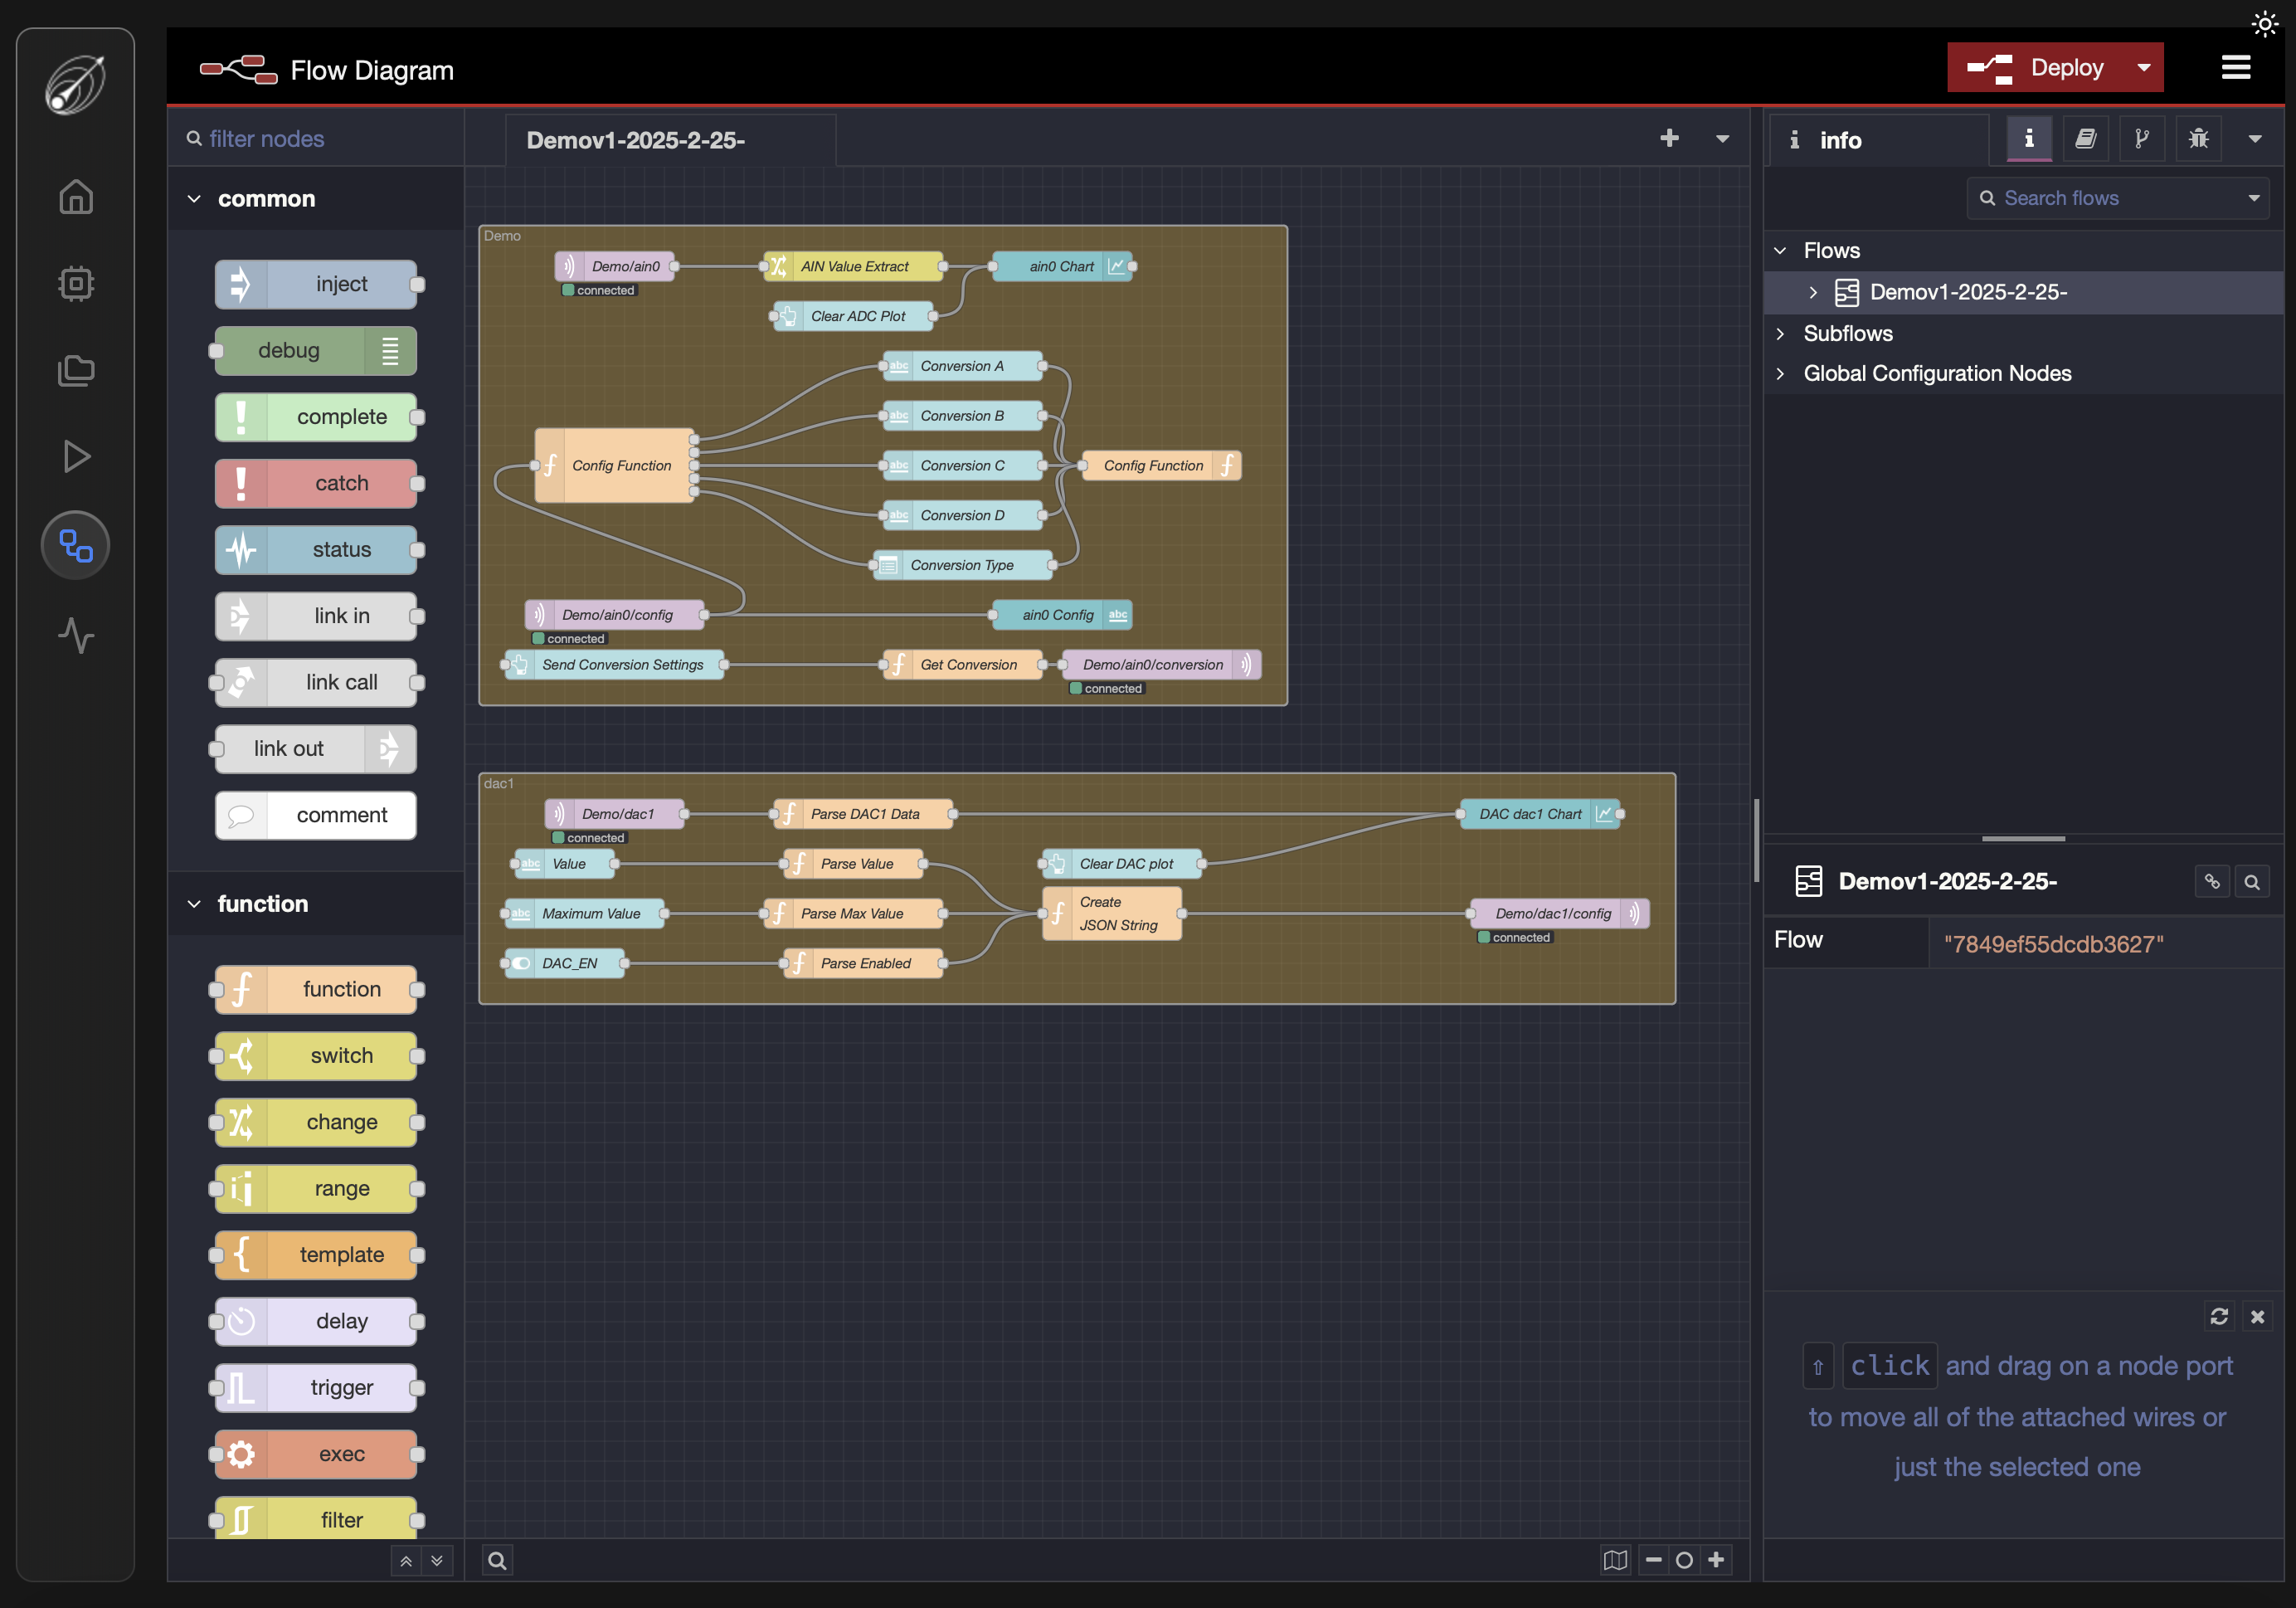
In the Flow Diagram page accessed via the sidepanel button directly below the Run button, the user gets access to the Node-Red flows associated with their various control panels. This page provides a visual programming interface to add any number of functionalities to the DAQAstra's existing services and generated interfaces.
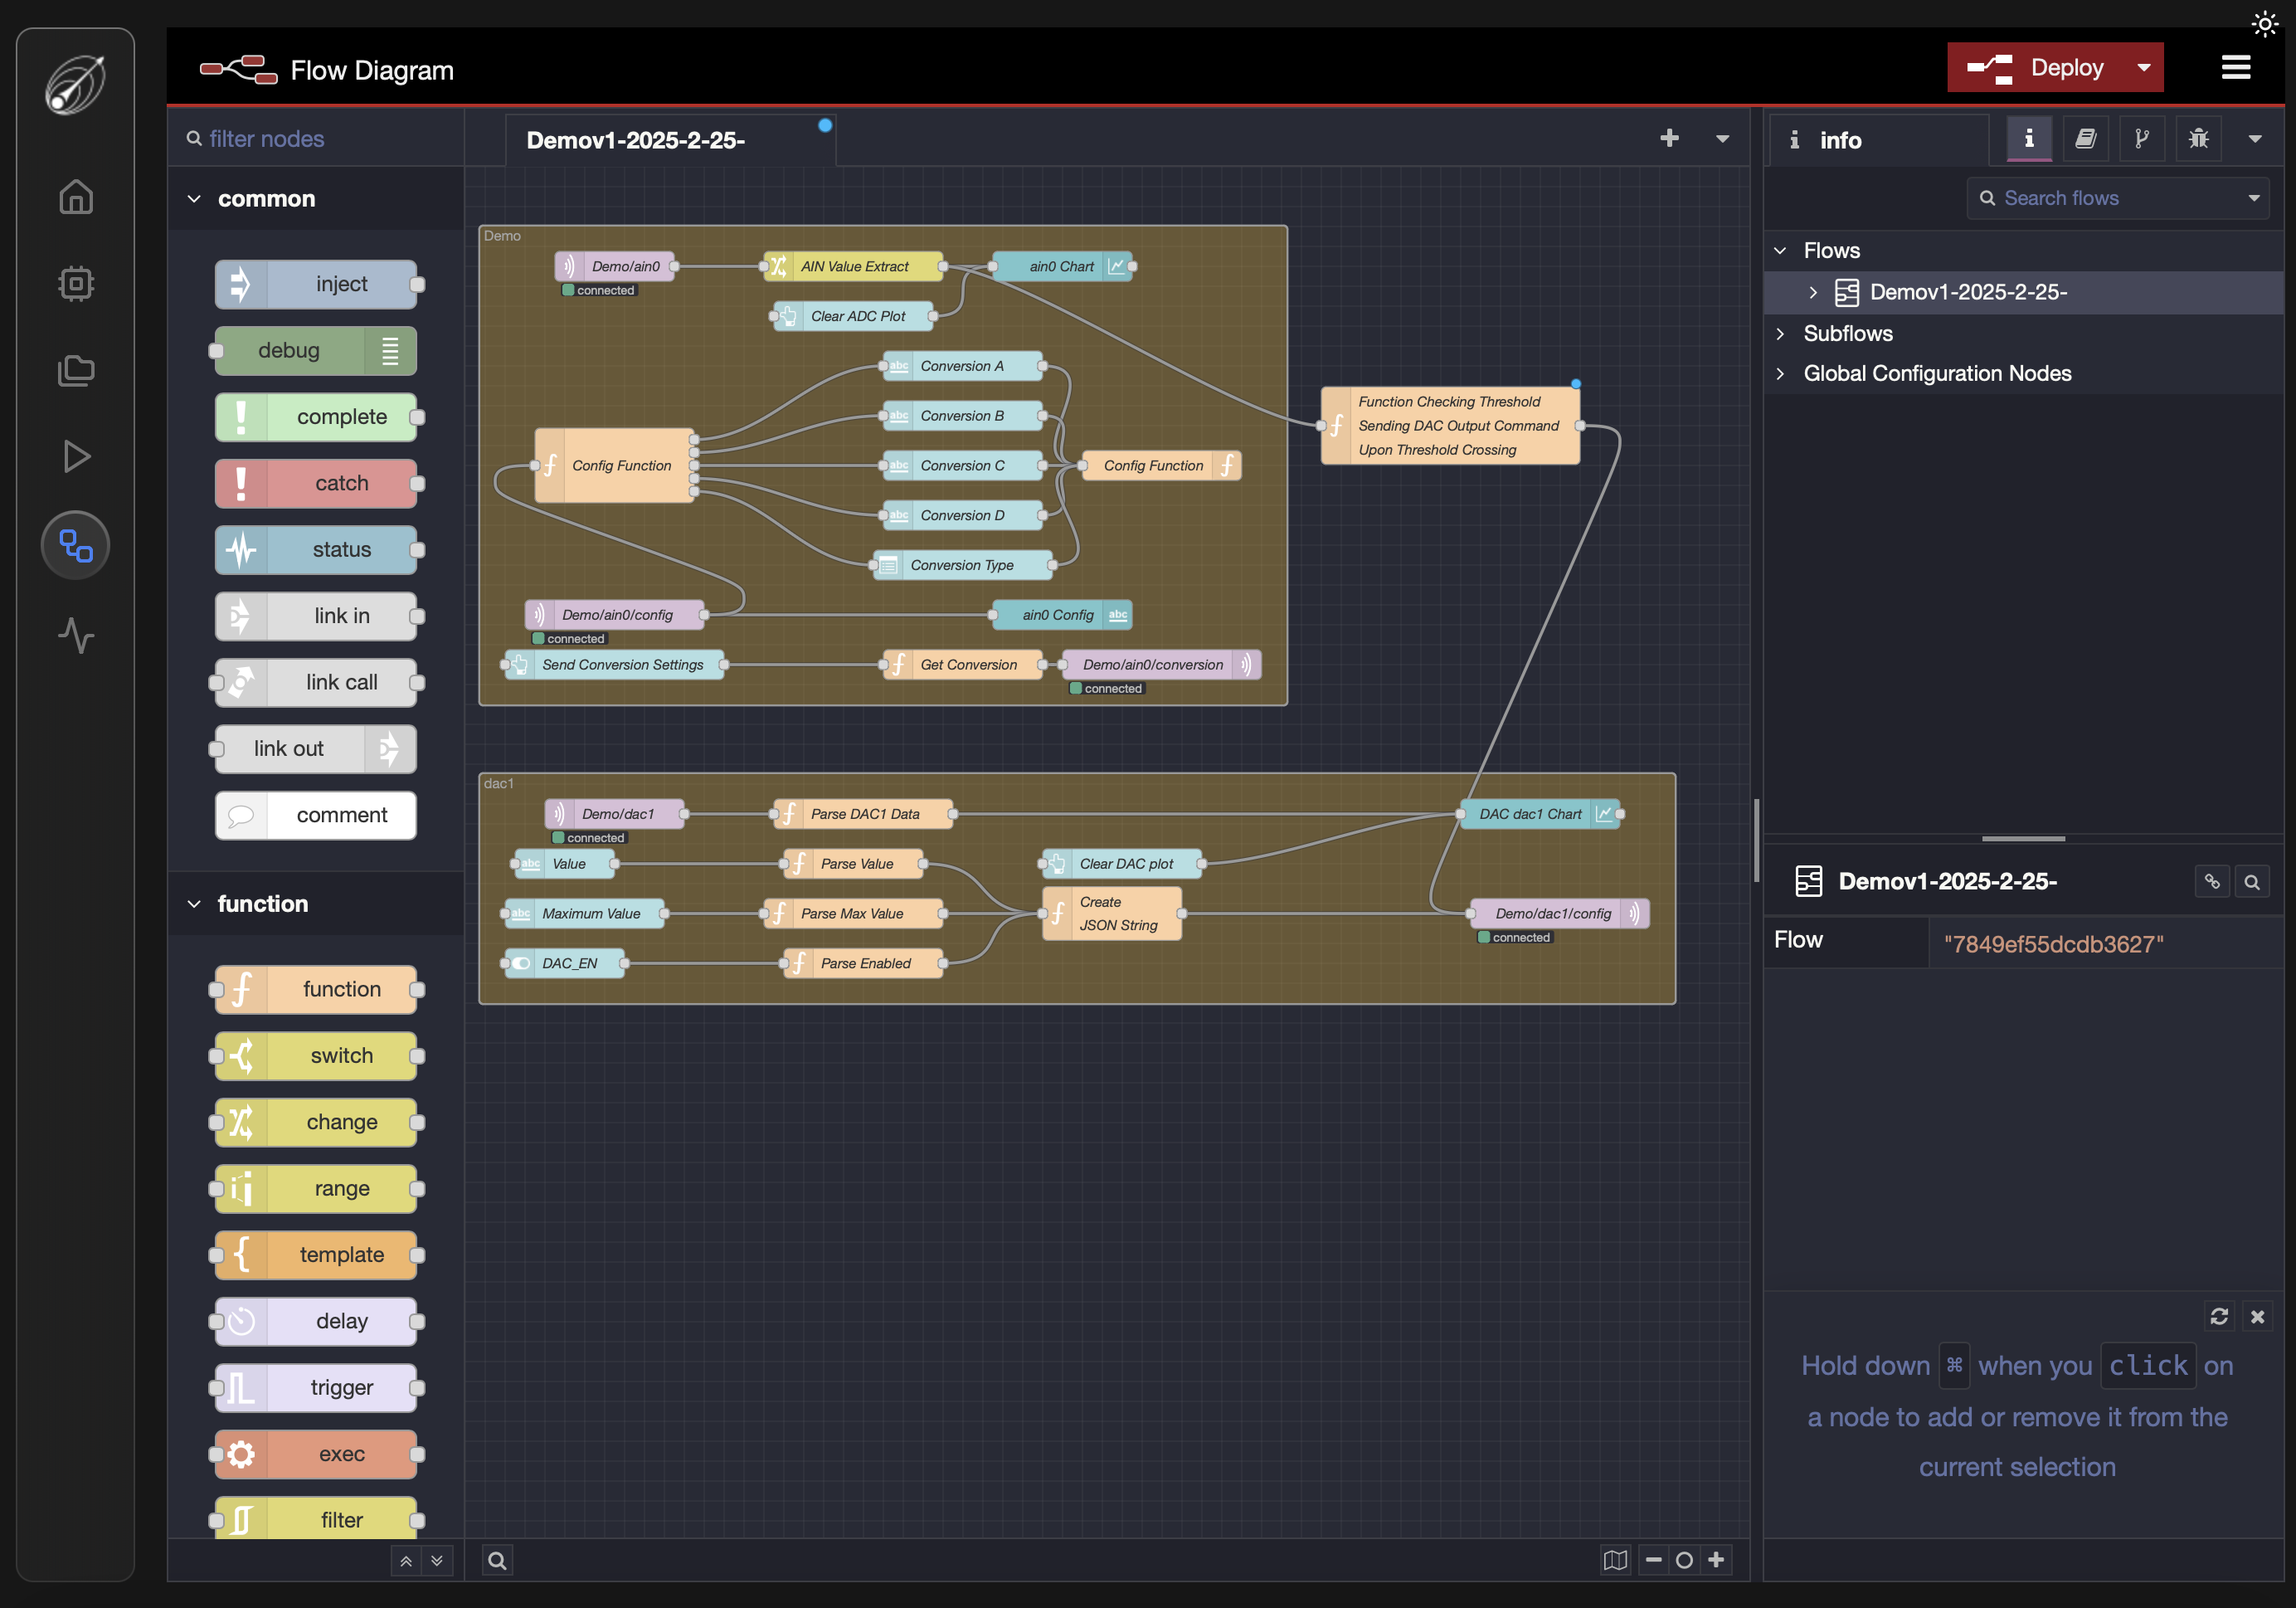
An example of such an additional functionality is demonstrated in the above example. Here, a function is added that takes messages from the DAQAstra containing measurements from analog-input on pin AIN0. The function checks if that measurement exceeds a threshold, then outputs a command for the DAQAstra's analog-output based on that threshold comparison result. This could be used for a very simple application like controlling a DC motor's speed based on some sensor measurement. Node-Red also ships nodes that handle scheduling, state-machines, complex mathematics and even LLM intergrations. It also provides a very large number of interface nodes for every kind of communication protocol imaginable, allowing other devices on your network to plug into the DAQAstra's services.
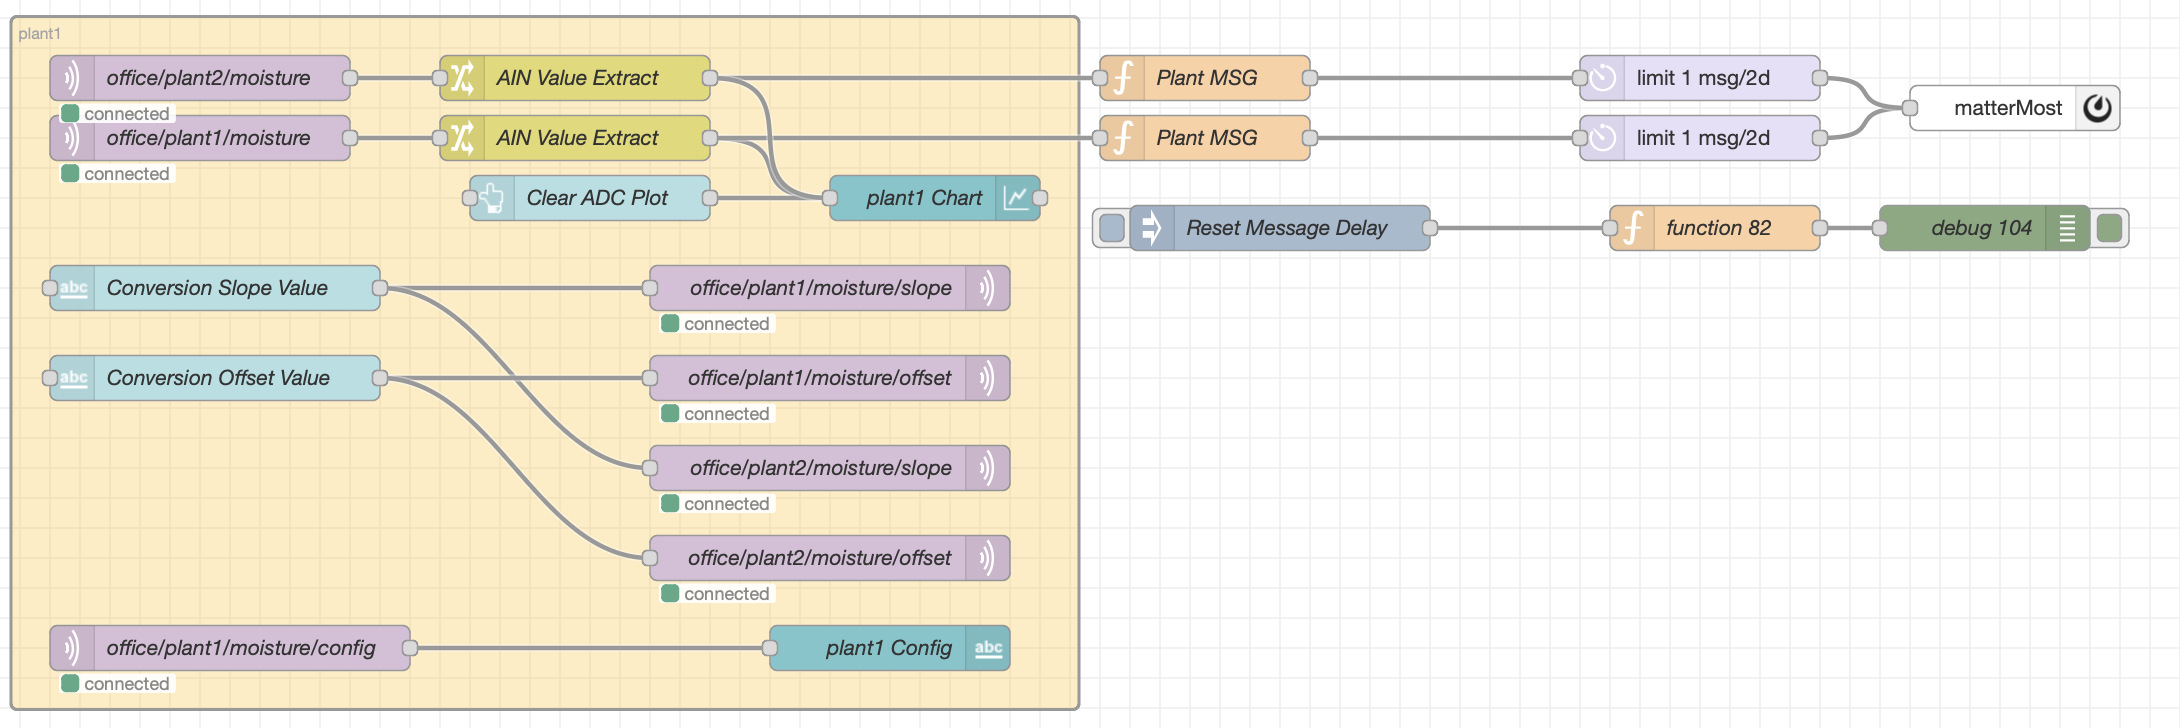
Here's another example flow used in the lab at TransAstra. Here, a DAQAstra is connected to a few soil moisture sensors and the measurements are compared against a minimum threshold. When the moisture drops too low, the flow triggers a rate-limited message to the company MatterMost, reminding employees to water the plants.
While these examples are relatively simple, they act to demonstrate the capability of Node-Red and the value that DAQAstra's tight integration with Node-Red brings to the table. At TransAstra, we use Node-Red and DAQAstra to rapidly get a project up and running. At that point, the need for more production-ready code may be necessary depending on the circumstance, however, this is no issue because fundamental design of this software has already be done in Node-Red and the API for the DAQAstra's services are documented for the convenience of any user.
InfluxDB
InfluxDB is a time-series database, meaning its intended use-case is to store data associated by timestamp, making it optimal for storing a time-history of data from DAQAstra and commands to them.
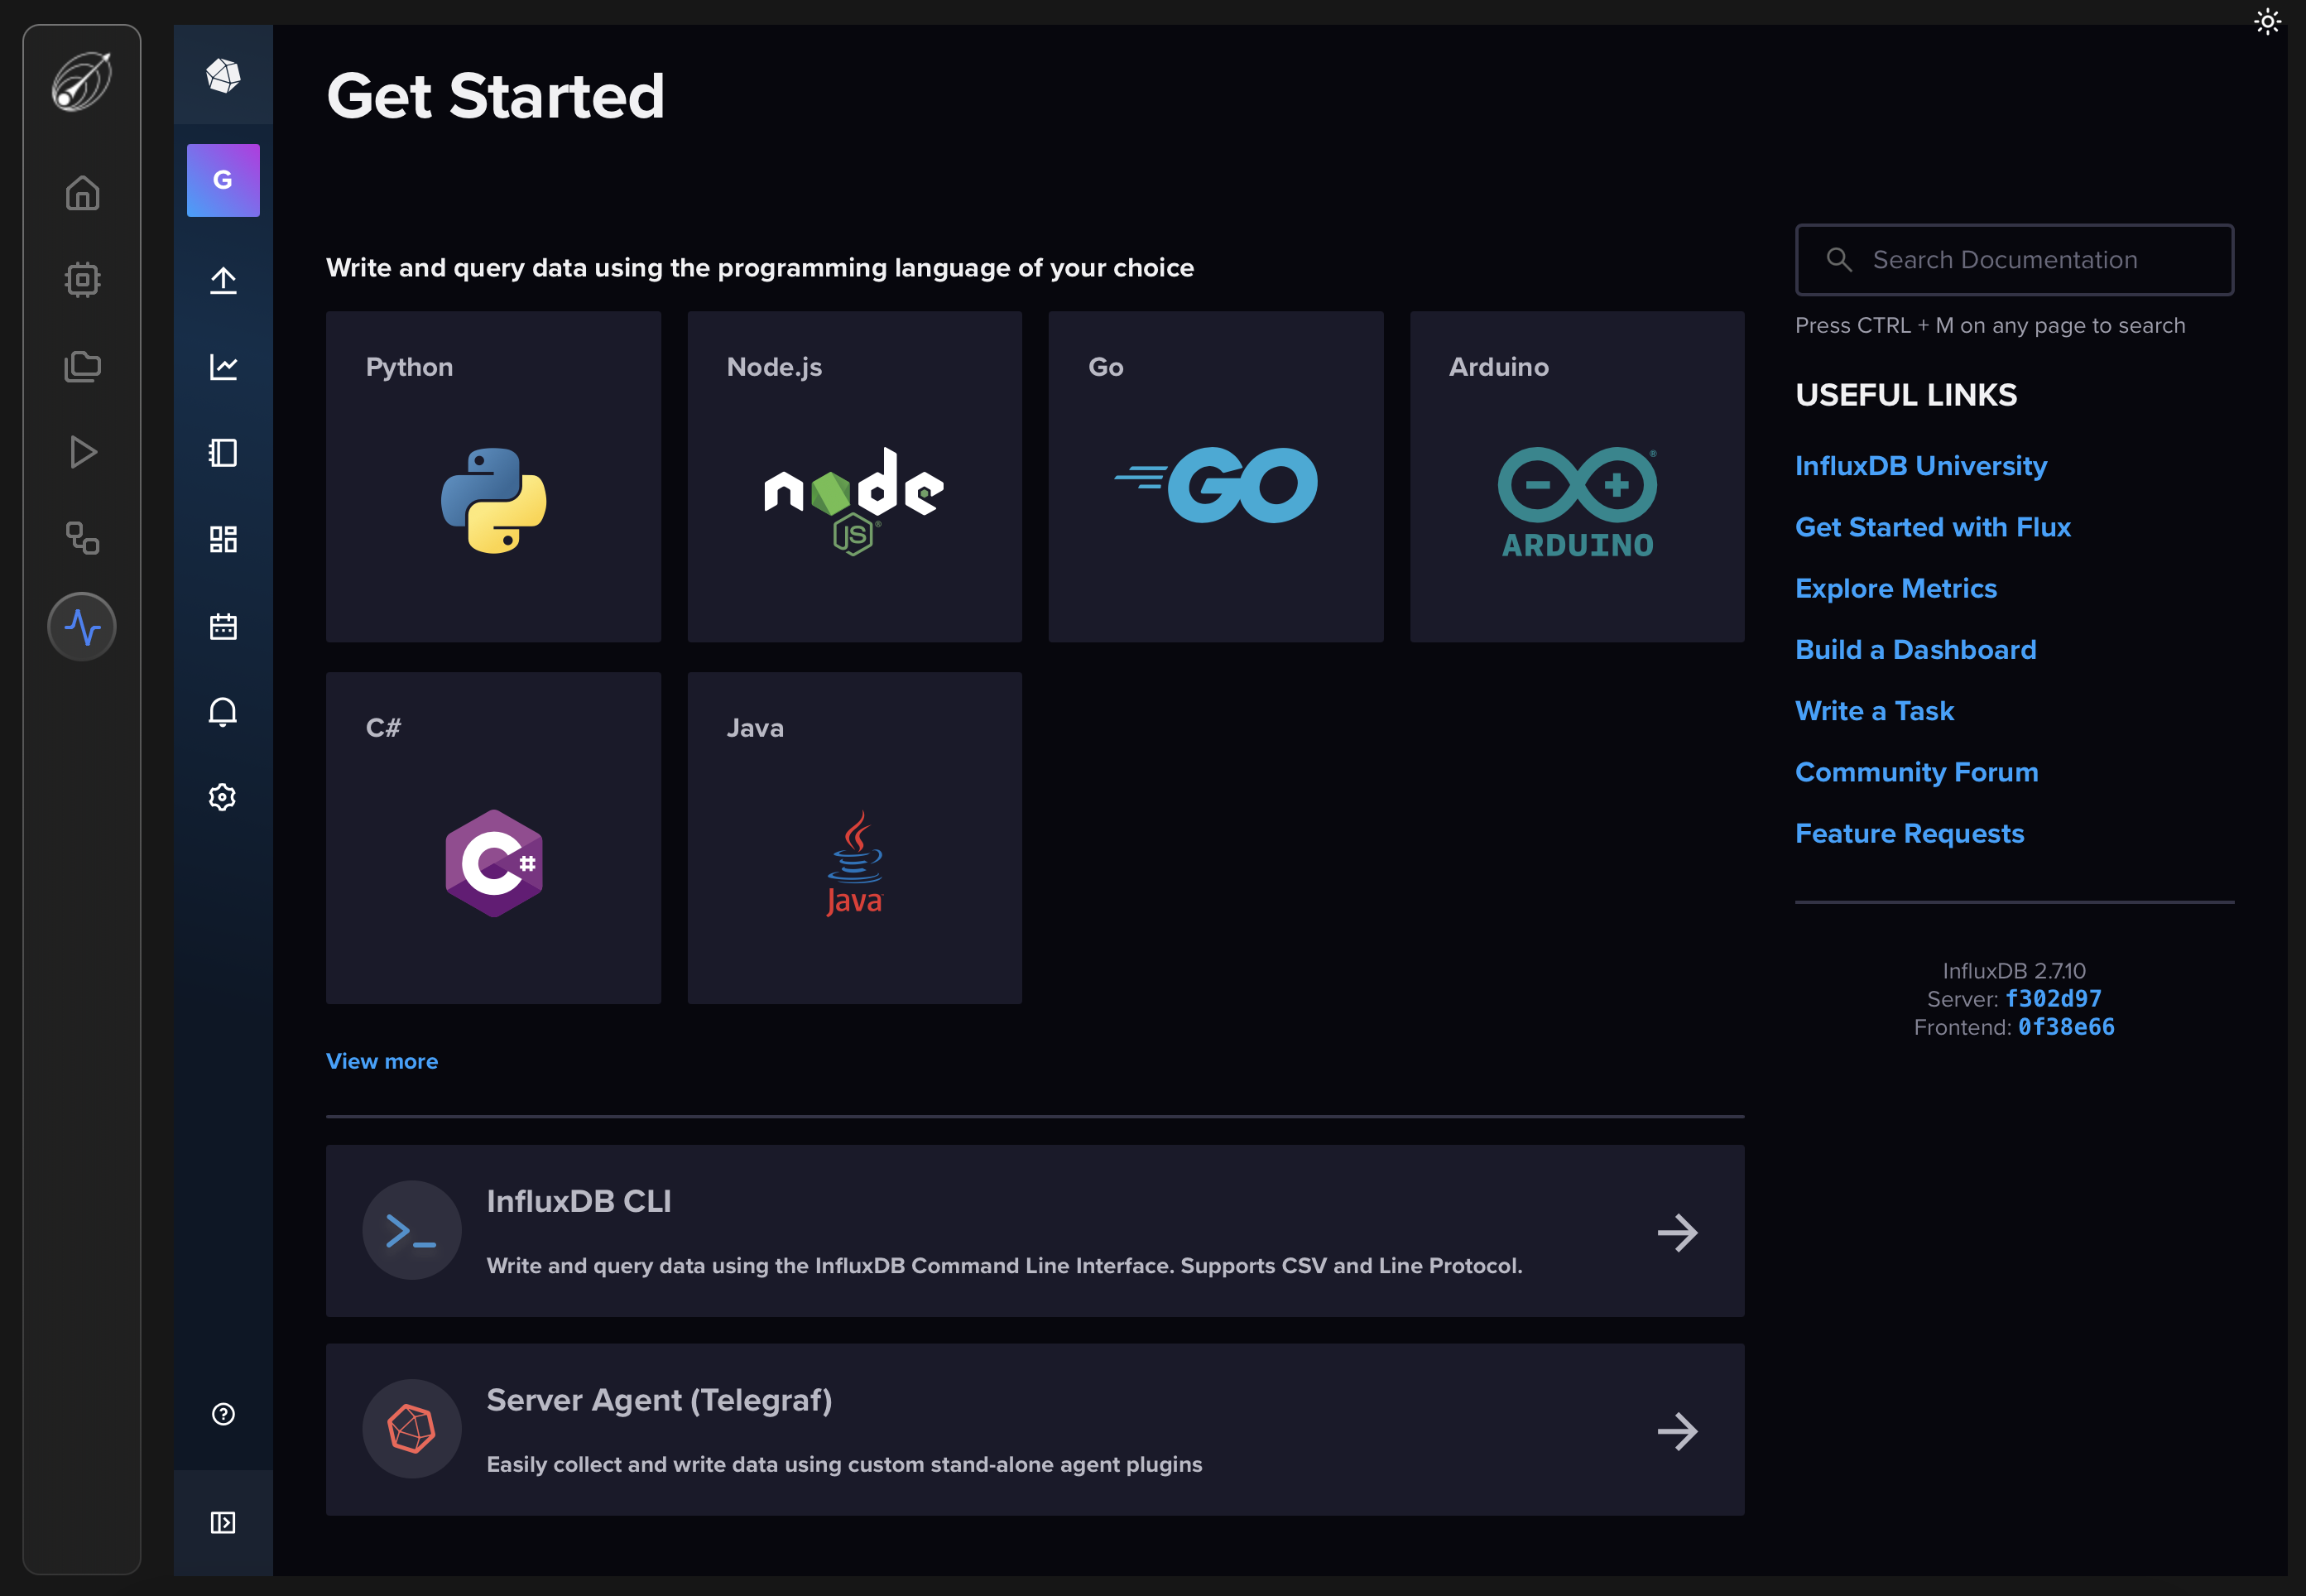
Start by accessing the page by accessing the Analyze page on the DAQAstra interface. This will take you to a login screen for InfluxDB. The default credentials are admin/password. The credentials may be changed via the influx CLI which is installed by default along with the application. The command to add, edit, or remove users from InfluxDB is documented here.
Upon logging in, you'll see the landing page pictured below.
The instance of InfluxDB shipped with the DAQAstra software is pre-configured to scrape all data that passes through the MQTT broker.
Once DAQAstra is plugged in and connected, the data being stored can be explored via the Data Explorer. Where you can filter data based on the MQTT topic associated with it.
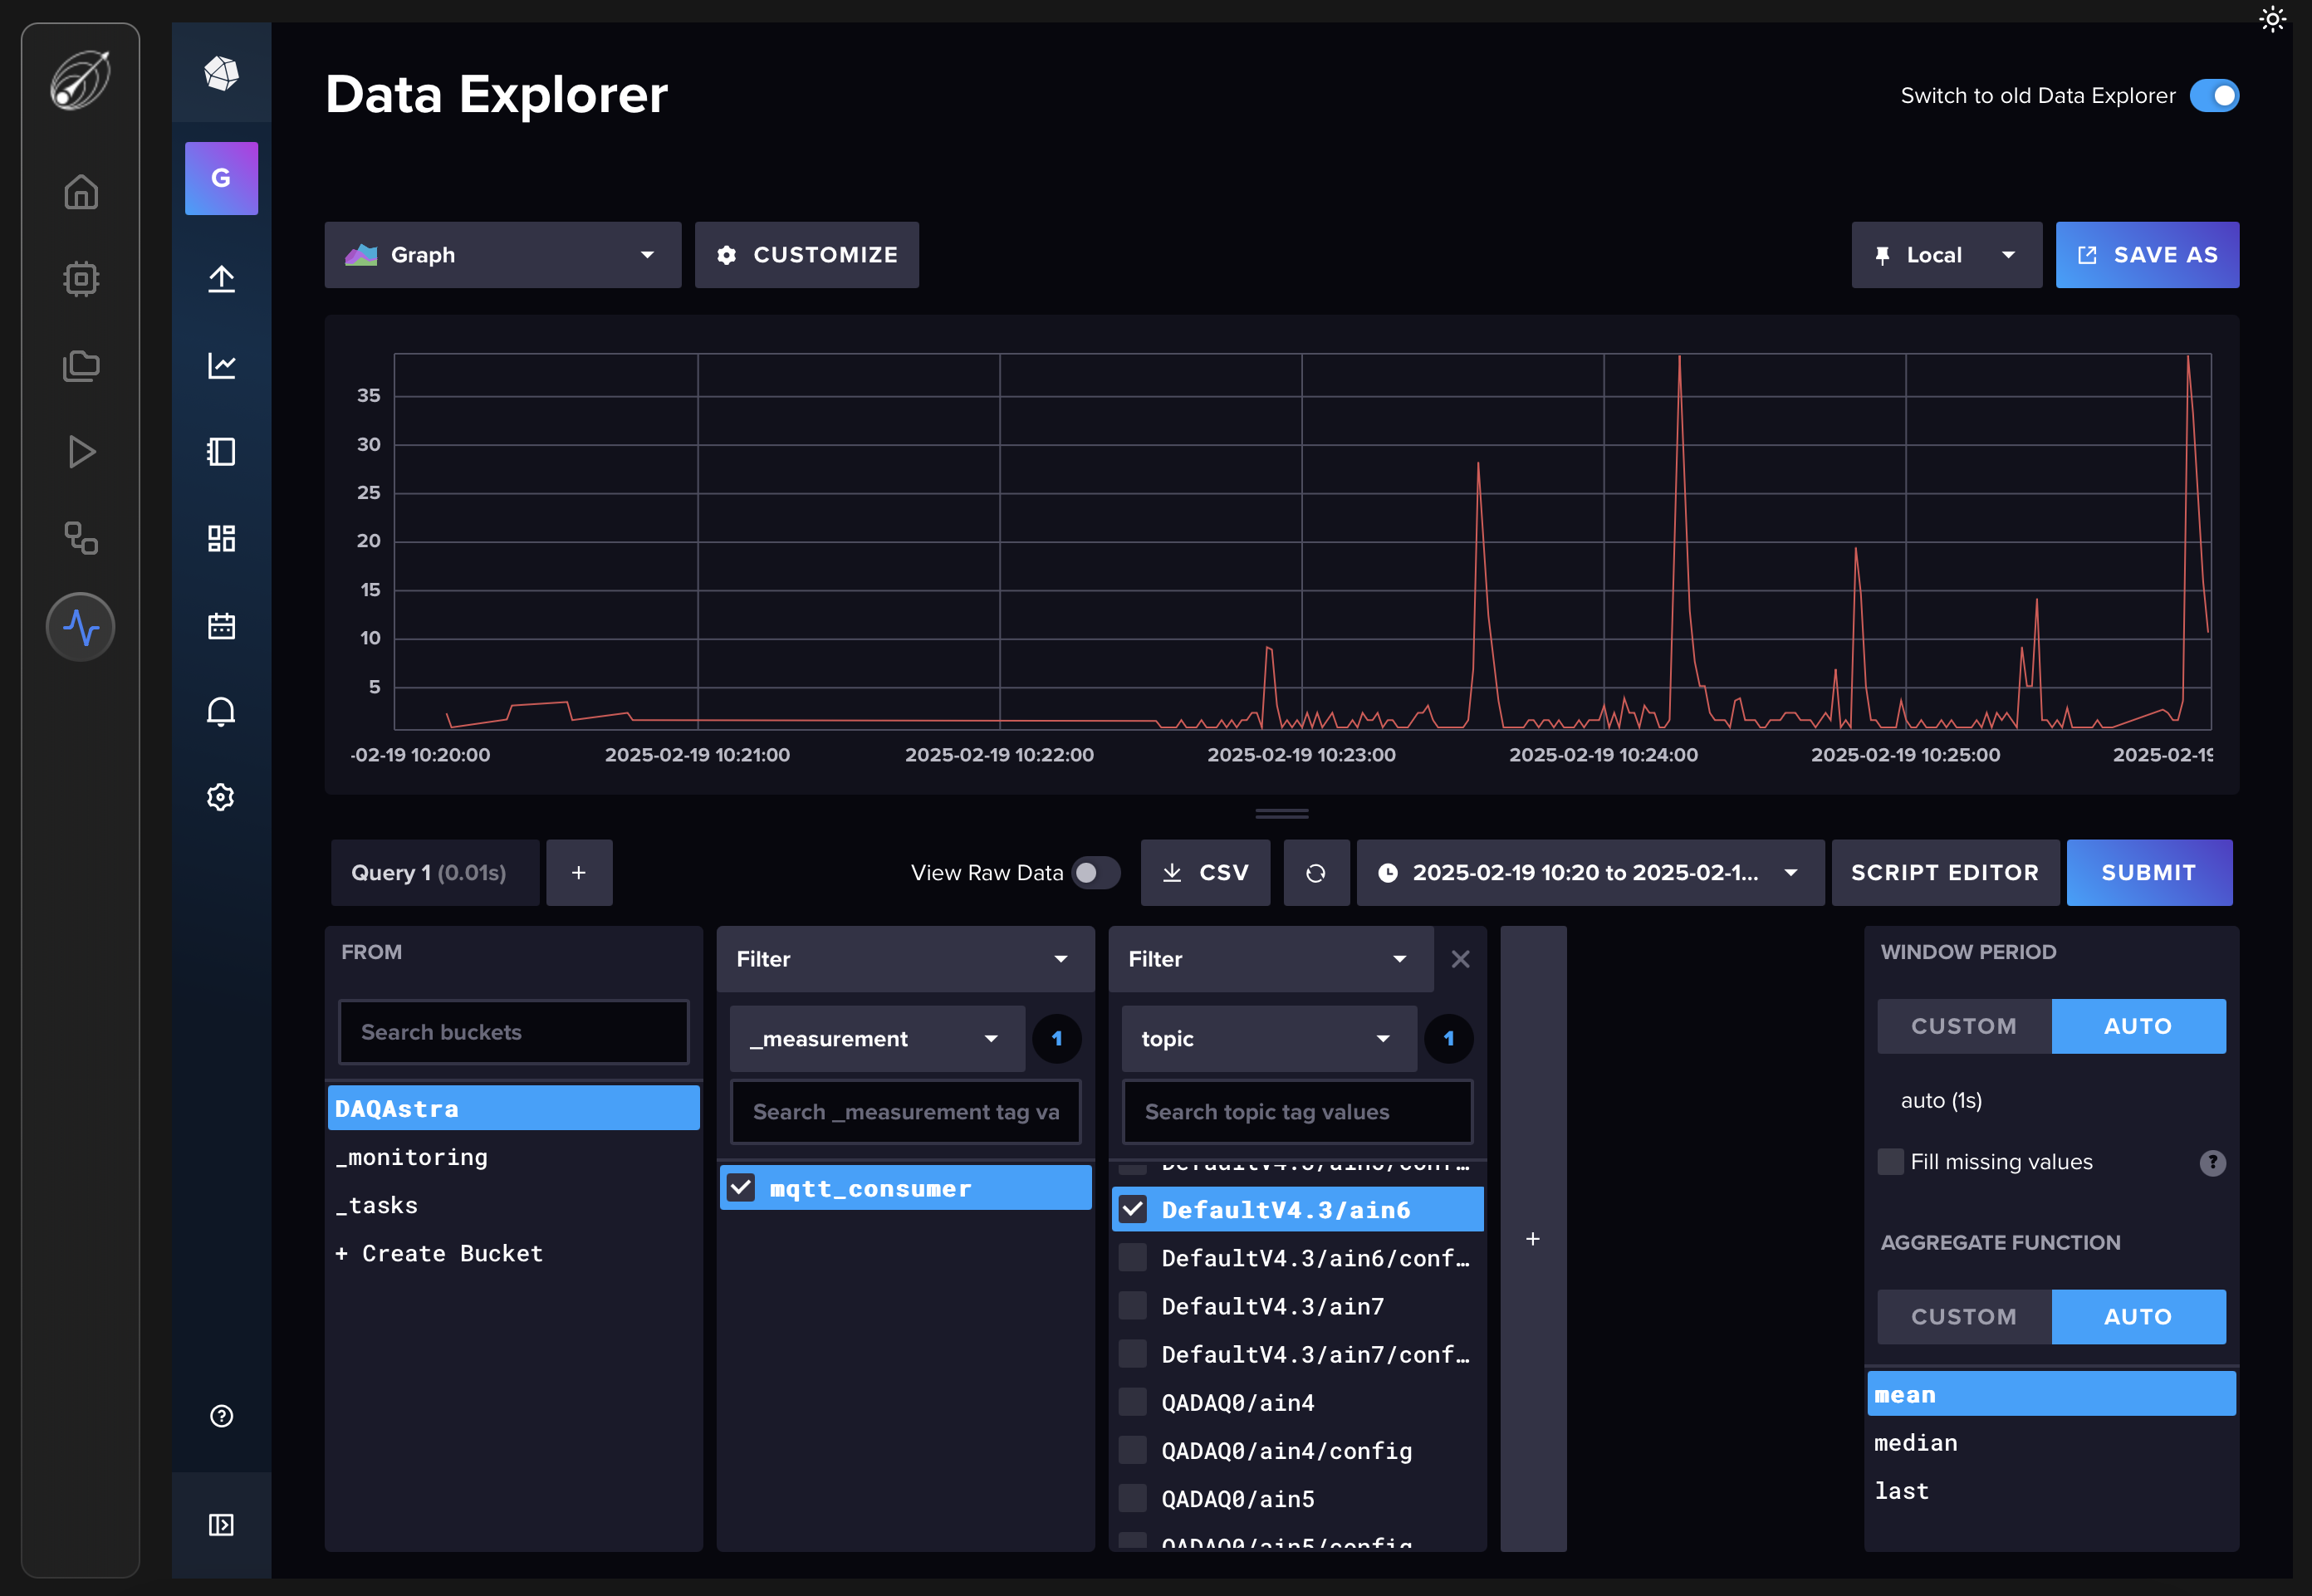
All services will publish its data and receive its commands at a topic consisting of {firmware_name}/{service_name}/.... The full list of topics for all services can be found in the MQTT API documentation.
Installation Guide
The installation of the DAQAstra application on each supported operating system is covered in the below sections.
Installer BOM (All OS)
The installation scripts will download and install all dependencies for the DAQAstra Application.
- Xcode Command Line Tools (Dependency of Homebrew package manager)
- Homebrew (Used to fetch and install known-good copies of sidecar binaries)
- arm-none-eabi-gcc (Linker for DAQAstra MPU)
- influxdb (OSS time-series database)
- influx-cli (CLI Utility for configuring InfluxDB instance)
- telegraf (Data scraping service to pull DAQAstra data from the network and into InfluxDB)
- The Rust Programming Language (Needed to compile firmware for DAQAstra hardware)
- Note If Rust is already installed via Homebrew, it will be removed and replaced with the standard Rust installation.
- Node.js v22.11.0
- Node-RED
Windows installer also includes MinGW64 to provide the GNU compiler for Rust. This requires much lower overhead than the MSVC alternative.
Table of Contents
MacOS
-
Uncompress the provided .zip file. It should contain three files:
- DAQAstra_{version_number}_universal.dmg
- install
- uninstall
-
Open this folder in a terminal window and run
bash install -
Open the .dmg file and drag
DAQAstraintoApplications. -
See final steps
Windows
-
Unzip the compressed folder and run the installer. Do not run as administrator.
-
Reboot your PC when given the option at the end of the installation.
-
See final steps
Linux
- Untar the directory.
tar -xvf {name_of_tarball}.tar.gz
- Navigate into the uncompressed folder and run the installation script.
sudo bash install.sh
- Install the debian application bundle.
sudo dpkg -i {name_of_debian_file}.deb
- The app will create a systemd service in the installation process. It can be enabled/disabled via systemd.
sudo systemctl {start/stop} server.service
- See final steps.
Final Steps
- Launch the application & click on the
Licensemenu. - Login to your DAQAstra account and claim a license if one is available.


Lastly, restart the Application
I/O & Pinout
Connector Diagram
SuperSeal Connector Diagram -- Looking into the connector
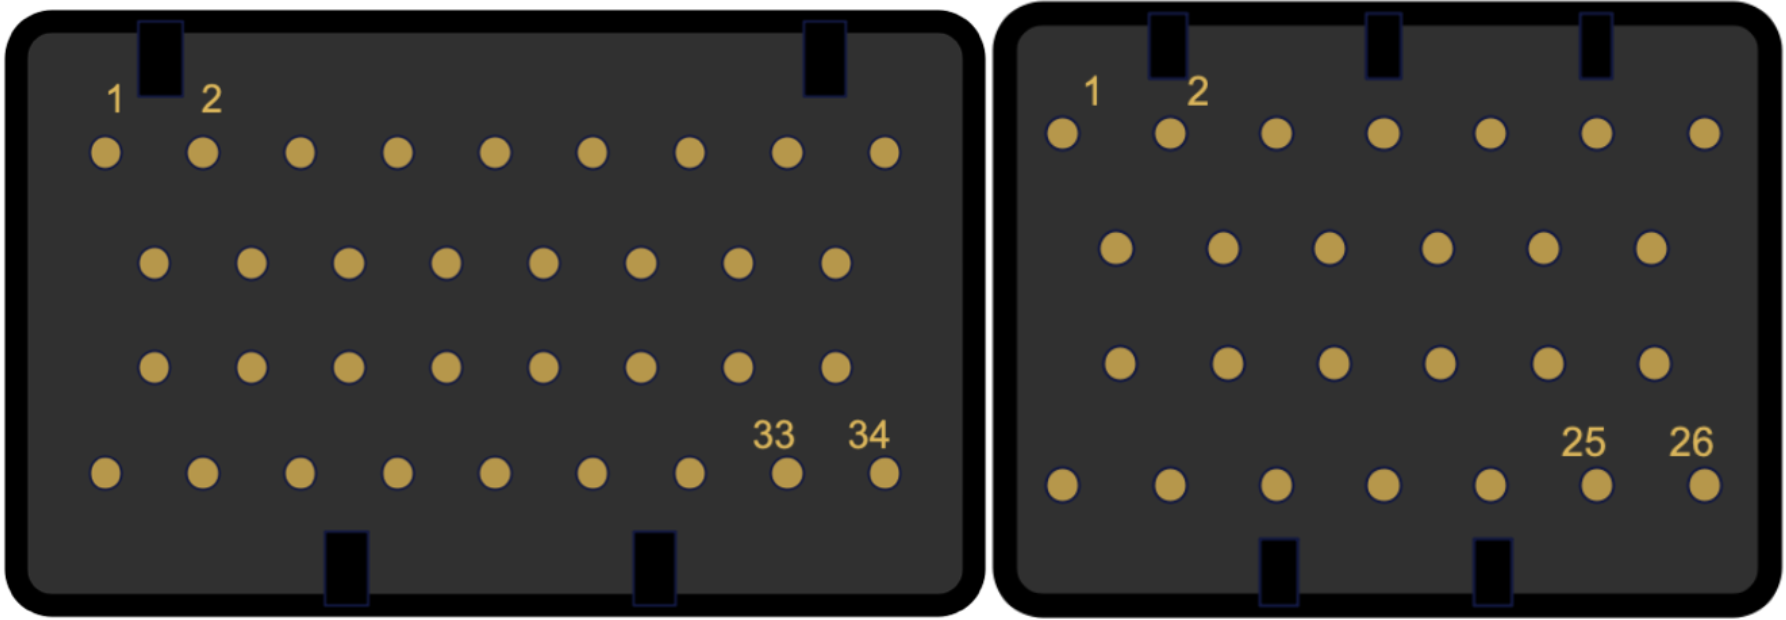
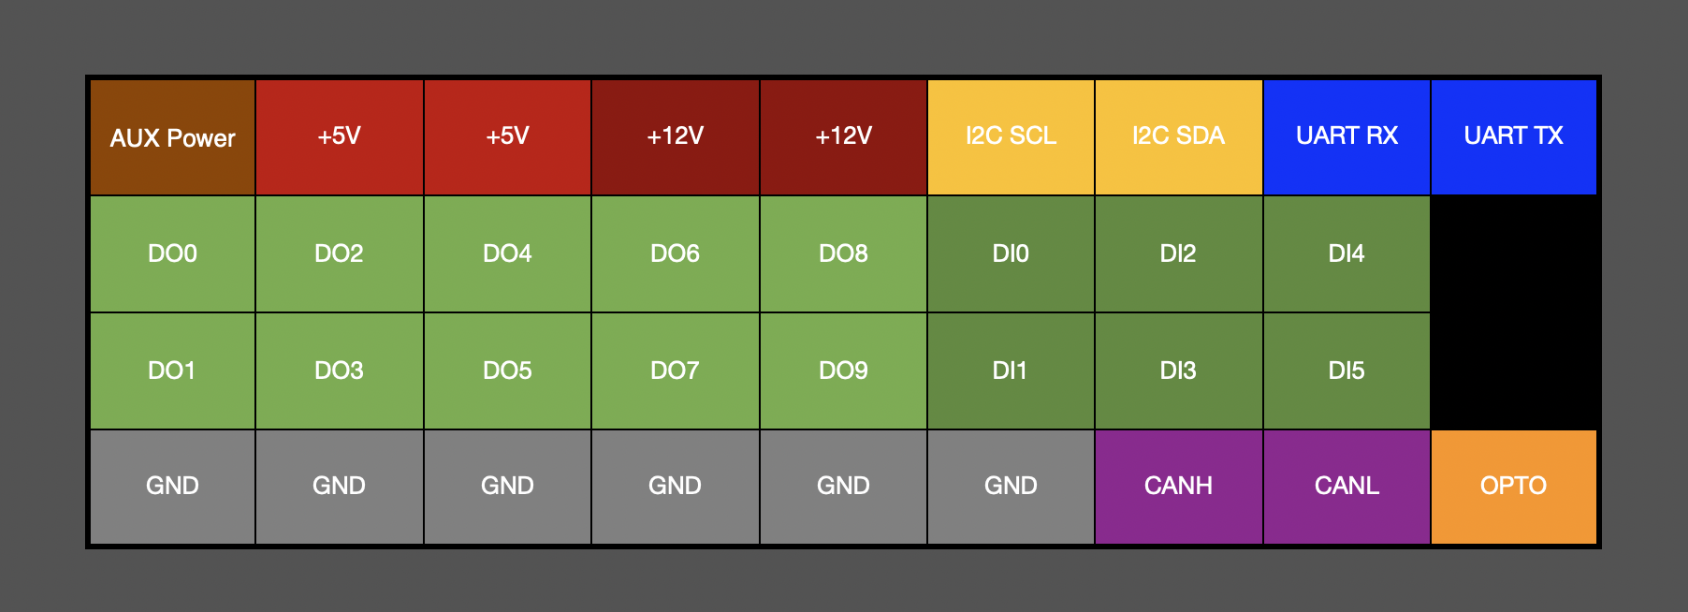
34-Pin Connector Pinout
|
Pin Number |
Pin Name |
Description |
| 1 | AUX Power |
12-32VDC power supply input. Hot-swappable with PoE. |
| 2 |
+5V |
5VDC, 1A output supply |
| 3 |
+5V |
5VDC, 1A output supply |
| 4 |
+12V |
12VDC output supply. 2.5A if using AUX, 1.4A if using PoE |
| 5 |
+12V |
12VDC output supply. 2.5A if using AUX, 1.4A if using PoE |
| 6 | SCL | I2C Bus SCL |
| 7 | SDA | I2C Bus SDA |
| 8 | UART RX | This is not crossed-over on our side. Connect to another device’s TX pin. |
| 9 | UART TX | This is not crossed-over on our side. Connect to another device’s RX pin. |
| 10 | DO0 | 0-3V3 sourcing digital-outputs. NOT ISOLATED, DUT must be grounded to DAQAstra. PWM on TIMER 11 |
| 11 | DO2 | PWM on TIMER 4 |
| 12 | DO4 | PWM on TIMER 8 |
| 13 | DO6 | PWM on TIMER 9 |
| 14 | DO8 | PWM on TIMER 2 |
| 15 | DI0 |
Digital-Inputs are isolated. Use the jumpers on DAQAstra to use the internal 5V as the open-drain input's logic-high. Use the OPTO selection to use an external voltage, instead. All digital-inputs share the same logic supply. Add series resistors to current-limit. 500 ohm for 12V, 1000 ohm for 24V. |
| 16 | DI2 | |
| 17 | DI4 | |
| 18 | DO1 | PWM on TIMER 10 |
| 19 | DO3 | PWM on TIMER 4 |
| 20 | DO5 | PWM on TIMER 9 |
| 21 | DO7 | PWM on TIMER 3 |
| 22 | DO9 | PWM on TIMER 2 |
| 23 | DI1 | |
| 24 | DI3 | |
| 25 | DI5 | |
| 26 | GND | Ground |
| 27 | GND | Ground |
| 28 | GND | Ground |
| 29 | GND | Ground |
| 30 | GND | Ground |
| 31 | GND | Ground |
| 32 | CANH | |
| 33 | CANL | |
| 34 | OPTO | External supply for DI pins |
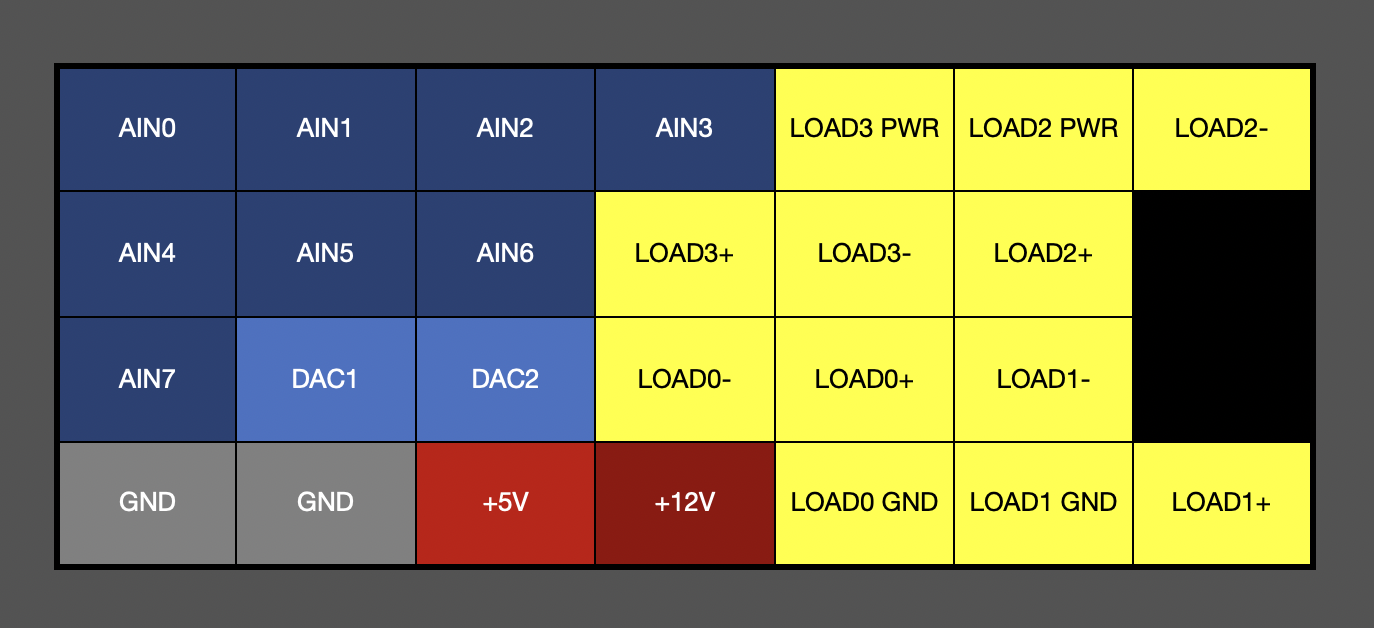
26-Pin Connector Pinout
|
Pin Number |
Pin Name |
Description |
Notes |
| 1 | AIN0 | Analog-to-Digital Converter Input 0 | 0 - 5V, 12-bit. Input buffered using voltage-follower. |
| 2 | AIN1 | Analog-to-Digital Converter Input 1 | 0 - 5V, 12-bit. Input buffered using voltage-follower. |
| 3 | AIN2 | Analog-to-Digital Converter Input 2 | 0 - 5V, 12-bit. Input buffered using voltage-follower. |
| 4 | AIN3 | Analog-to-Digital Converter Input 3 | 0 - 5V, 12-bit. Input buffered using voltage-follower. |
| 5 | LOAD3 PWR | High-Side Solid-State Relay 3 Power Supply |
Connect the positive lead of voltage supply to power LOAD3. Must be <50V and external supply GND must be tied to a DAQAstra GND pin. |
| 6 | LOAD2 PWR | High-Side Solid-State Relay 3 Power Supply |
Connect the positive lead of voltage supply to power LOAD2. Must be <50V and external supply GND must be tied to a DAQAstra GND pin. |
| 7 | LOAD2- | High-Side Solid-State Relay 2 Load Cathode |
Switched load negative lead. Optional connection adding a flyback diode to clamp inductive spikes from switched inductive loads. |
| 8 | AIN4 | Analog-to-Digital Converter Input 4 | 0 - 5V, 12-bit. Input buffered using voltage-follower. |
| 9 | AIN5 | Analog-to-Digital Converter Input 5 | 0 - 5V, 12-bit. Input buffered using voltage-follower. |
| 10 | AIN6 | Analog-to-Digital Converter Input 6 | 0 - 5V, 12-bit. Input buffered using voltage-follower. |
| 11 | LOAD3+ | High-Side Solid-State Relay 3 Load Anode | Switched load positive lead. |
| 12 | LOAD3- | High-Side Solid-State Relay 3 Load Cathode |
Switched load negative lead. Optional connection adding a flyback diode to clamp inductive spikes from switched inductive loads. |
| 13 | LOAD2+ | High-Side Solid-State Relay 2 Load Anode | Switched load positive lead. |
| 14 | AIN7 | Analog-to-Digital Converter Input 7 | 0 - 5V, 12-bit. Input buffered using voltage-follower. |
| 15 | DAC1 | Digital-to-Analog Converter Output 1 | 0-5V or 0-12V, 12-bit analog output. The maximum output voltage is selectable via the DAC VCC jumper on the PCB. |
| 16 | DAC2 | Digital-to-Analog Converter Output 2 |
0-5V or 0-12V, 12-bit analog output. The maximum output voltage is selectable via the DAC VCC jumper on the PCB. The jumper controls both DAC channels. |
| 17 | LOAD0- | Low-Side Solid-State Relay 0 Load Cathode | Switched load negative lead. |
| 18 | LOAD0+ | Low-Side Solid-State Relay 0 Load Anode |
Switched load positive lead. Optional connection adding a flyback diode to clamp inductive spikes from switched inductive loads. |
| 19 | LOAD1- | Low-Side Solid-State Relay 1 Load Cathode | Switched load negative lead. |
| 20 | GND | GND | |
| 21 | GND | GND | |
| 22 |
+5V |
5V DC Output Power | 1.5A PTC Polyfuse in series with output. Voltage supply limited to continuous drain of 1A. |
| 23 |
+12V |
12V DC Output Power | This rail has OVP, UVLO, and OCP. Limited to 2.5A. |
| 24 | LOAD0 GND | Low-Side Solid-State Relay 0 Supply GND |
Connect the negative lead of voltage supply to power LOAD0. Must be <50V and external supply GND must also be tied to a DAQAstra GND pin. |
| 25 | LOAD1 GND | Low-Side Solid-State Relay 1 Supply GND |
Connect the negative lead of voltage supply to power LOAD1. Must be <50V and external supply GND must also be tied to a DAQAstra GND pin. |
| 26 | LOAD1+ | Low-Side Solid-State Relay 1 Load Anode |
Switched load positive lead. Optional connection adding a flyback diode to clamp inductive spikes from switched inductive loads. |
Pinout Legend
SuperSeal Pinout Legend
Power Outputs
- +5V**:** protected by a PTC resettable fuse rated at 1.5A. Generally used for power sensors or external modules.
- +12V: protected by a power-management integrated-circuit (PMIC), preventing current draw over 2.5A.
DAC - Digital-to-Analog Converter:
- Allows for the DAQAstra’s microcontroller to provide analog signals (e.g. a feedback control signal)
- The DAC can drive up to 60mA and features a low-pass filter with a 3dB cutoff at 160kHz.
- Outputs an analog voltage ranging from 0-12V with 12-bit/3 millivolt accuracy.
- The DAC is often used as a control-signal output for other controllers, like a mass-flow controller or DC-Motor drive. They are also often used in audio reproduction or as waveform generators.
AIN - Analog-to-Digital Converter:
- Allows for the DAQAstra’s microcontroller to read analog signals (e.g. transduced audio or temperature signals).
- All analog signals read through the SuperSeal are buffered by a unity-gain op-amp, providing stability in the measurement.
- Reads an analog voltage ranging from 0-5V with 12-bit accuracy, or 4096 1.2 millivolt steps across the measurement range.
- The firmware oversamples the 12-bit samples to achieve 16-bit data. This is often used for measuring analog information about the environment (temperature, humidity, pressure).
PLCIN - Isolated PLC Digital Input:
- Electrically isolated input, designed for -60–60V Discrete inputs, such as the 24V I/O often found on PLCs.
- Up to 4Mbps data rate
CAN Bus:
- Controller Area Network bus differential inputs (CAN_P and CAN_N), connected to a CAN Transceiver.
- Offers up to 1Mbps data rate.
DIO - Digital Input/Output:
- Sends or receives digital logic signals in 5VTTL. There are ten DIO pins, all capable of acting as either an input or output. All GPIO from the DAQAstra are protected via a level-shifter.
- NOTE: The level shifters that interface between the microcontroller and I/O pins do not drive the outputs to GND when the microcontroller pins are not driven (e.g. the board firmware is changing, or the board is disconnected). In this state, the outputs are High-Z (floating).
LOWSIDE - Solid-State Relay
- An array of four Gate Driver ICs, each connected to an N-Channel MOSFET. Acts by connecting/disconnecting a load’s current return to ground. Features a TVS diode in parallel with the MOSFET, allowing for overvoltage protection and safe connection of inductive loads.
- Rated for ~2A continuous current and up to 10A pulsed current.
- Users can choose between connecting the high side of their load to the board’s internal 12V output, or an external output. In the former case, GNDPWR and GND must be connected (as the Lowside switches use GNDPWR as their return). This is done by shorting the pins on the GND Isolation Jumper, shown in the board render above.
Auxiliary Power Input
- Auxiliary power enters from the 2-Terminal Female Input and is converted to Regulated 12V, via a switching converter. An Integrated Circuit switches between a supply voltage from PoE and the regulated 12V Auxiliary.
- The pin closest to the pin-one indicator is the VCC pin. The other is GND.
FAQs
Where is my Application Hosted on the network?
Once you have the software running, the user-interface will be hosted at the IP address of the machine hosting the Application on port 5172.
If you have TLS certs configured on your instance, http:// requests to port 5172 will be re-directed to https:// on port 5174.
Where is the configuration directory for the Application?
Linux
~/.config/daqastra
Windows
%appdata%\Roaming\TransAstra\DAQAstra\config
MacOS
~/Library/Application Support/com.TransAstra.DAQAstra
Configuration Directory Structure
.
├── .certs
├── .node-red
│   ├── flows.json # <- Your Node-RED flows
│   ├── flows_cred.json
│   ├── lib
│   ├── node_modules
│   ├── package-lock.json
│   ├── package.json
│   └── settings.js # <- Node-RED settings
├── database
│   ├── database.db # <- DAQAstra Appication Database
│   ├── database.db-shm
│   ├── database.db-wal
│   └── migrations
│       ├── 20240127_init.down.sql
│       ├── 20240127_init.up.sql
│       └── 20250502__add_gateway_ip_to_identifier_key.sql
├── firmware # <- DAQAstra firmware & configs built by the Application
│   ├── DefaultV4.2
│   │   └── v1
│   └── DefaultV4.3
│       └── v1
├── input # <- Used internally
├── logs # <- DAQAstra Application debug logs
│   └── gateway.ans
├── output # <- Used internally
├── rumqttd.toml # <- MQTT Broker Configuration
├── source # <- Source code libraries used for local firmware gen. and compilation.
│   ├── bsc
│   ├── bytes
│   ├── config-schema
│   ├── crypto-client
│   ├── done.txt
│   ├── firmwaregen
│   └── ser
├── default.json  # <- DAQAstra App Configuration
└── telegraf.conf # <- Telegraf Configuration (data scraper)
DAQAstra Configuration File
{
  "daqastra_dashboard":true,
  "influxdb_dashboard":true,
  "node_red_editor":true
}
-
daqastra_dashboard: Enables/Disables the DAQAstra UI (only valid for headless or lite applications) -
influxdb_dashboard: Enables/Disables InfluxDB webUI. API will still remain accessible. -
node_red_editor: Enables/Disables NodeRED editor, but leaves the NodeRED dashboard enabled. This makes the editting of NodeRED flows at runtime impossible.
How can I use HTTPS/TLS certificates on my Application Instance?
Stop the Application instance if it is running, and generate .pem files (key.pem and cert.pem) for your desired TLS certificate.
Place the key and certificate into your Application's configuration directory in the .certs folder. Restart the Application
instance and the UI and backend will be behind https:// and using the newly added certificate.
Note: Doing this will automatically put InfluxDB behind the same TLS certificates. However, Node-RED and Telegraf do not get the same treatement.
Node-RED TLS Setup
To have Node-RED use the TLS certificate, edit the settings file at {path/to/config/directory}/.node-red/settings.js and add the
following keys to the default configuration:
https: function () {
    return {
      key: require("fs").readFileSync("{path/to/config/directory}/.certs/key.pem"),
      cert: require("fs").readFileSync("{path/to/config/directory}/.certs/cert.pem"),
    };
  },
  httpsRefreshInterval: 12,
  requireHttps: true,
Telegraf TLS Setup
Navigate to the config directory for Application and edit telegraf.conf. The section to change is shown below. Change the
host url to https:// and the tls_cert and tls_key to the local path to your key and certificate.
[[outputs.influxdb_v2]]
  ## The URLs of the InfluxDB cluster nodes.
  urls = ["https://0.0.0.0:8086"]
  ## Token for authentication.
  token = "***"
  ## Organization is the name of the organization you wish to write to; must exist.
  organization = "Gateway"
  ## Destination bucket to write into.
  bucket = "DAQAstra"
  ## Optional TLS Config for use on HTTP connections.
#   tls_ca = "/etc/telegraf/ca.pem"
  tls_cert = "{path/to/config/directory}/.certs/cert.pem"
  tls_key = "{path/to/config/directory}/.certs/key.pem"
  ## Use TLS but skip chain & host verification
  insecure_skip_verify = true
Service MQTT API (DAQAstra)
All DAQAstra services communicate over MQTT using a publish / subscribe model.
A service topic prefix is always:
{firmware_name}/{service_name}
Spaces in service_name are converted to underscores.
Below each service lists:
- Command (subscription) topics it listens on
- Publish (output / status) topics it emits
- Payload schemas (JSON unless otherwise noted)
- Notes / semantics
Topic layouts are derived from the code in config-schema/src/schema/topics.rs (see the large comment block there) and the message structs in config-schema/src/messaging/*.rs.
If a field is optional it may be omitted or sent as null.
Version note: This document supersedes older copies that mixed legacy names. Always regenerate if message structs change.
Conventions
| Term | Meaning |
|---|---|
{prefix} | {firmware_name}/{service_name} |
| Boolean | true / false |
| Milliseconds | Unsigned 16/32-bit depending on context (see field) |
| Temperature | Degrees Celsius unless otherwise stated |
| Percent / Ratio | 0.0 – 1.0 floating-point |
| Integer ranges | Unless stated, unsigned and constrained by underlying hardware width |
actuator
Generic actuator command, state and fault reporting
| Topic Suffix | Dir | Kind | Example JSON |
|---|---|---|---|
/command | in | cmd | { "command": "OPEN" } |
/state | out | telemetry | { "command": "OPEN", "state": "OPEN", "success": true } |
/fault | out | event | { "error": "Unknown State", "state": "Unknown", "attempted_command": "OPEN" } |
Payload Schemas
/command ActuatorCommand
{ "command": "OPEN" }
/state ActuatorState
{ "command": "OPEN", "state": "OPEN", "success": true }
/fault ActuatorFault
{ "error": "Unknown State", "state": "Unknown", "attempted_command": "OPEN" }
aht20
AHT20 humidity / temperature sensor data
| Topic Suffix | Dir | Kind | Example JSON |
|---|---|---|---|
| `` | out | telemetry | { "temperature": { "value":22.8, "unit":"C" }, "humidity": { "value":40.1, "unit":"%RH" }, "dewpoint": { "value":9.7,… |
Payload Schemas
`` Aht20Data
{ "temperature": { "value":22.8, "unit":"C" }, "humidity": { "value":40.1, "unit":"%RH" }, "dewpoint": { "value":9.7, "unit":"C" } }
analog_in
Analog input channel telemetry and configuration
| Topic Suffix | Dir | Kind | Example JSON |
|---|---|---|---|
'' | out | telemetry | { "value": 0.123, "unit": "V" } |
/config | in | cmd | { "conversion": { "Polynomial": [0.0, 1.0, 0.0, 0.0] } } |
Payload Schemas
'' AnalogInData
{ "value": 0.123, "unit": "V" }
/config AnalogConversionConfig
{ "conversion": { "Polynomial": [0.0, 1.0, 0.0, 0.0] } }
analog_out
DAC / analog output configuration and feedback
| Topic Suffix | Dir | Kind | Example JSON |
|---|---|---|---|
/config | in | cmd | { "value": 2.5, "max_volts": 5.0, "enabled": true } |
/response | out | telemetry | { "value": 2.5, "max_volts": 5.0, "enabled": true, "error": null } |
Payload Schemas
/config DacConfig
{ "value": 2.5, "max_volts": 5.0, "enabled": true }
/response DacConfig
{ "value": 2.5, "max_volts": 5.0, "enabled": true, "error": null }
bang_bang
Bang-bang control loop command and status
| Topic Suffix | Dir | Kind | Example JSON |
|---|---|---|---|
/config | in | cmd | { "upper_threshold": 50.0, "lower_threshold": 40.0, "update_frequency": 1000, "pause_output": false, "pause_target_in… |
/response | out | telemetry | { "upper_threshold": 50.0, "lower_threshold": 40.0, "update_frequency": 1000, "pause_output": false, "pause_target_in… |
/output | out | telemetry | { "output": true, "input": 41.2 } |
Payload Schemas
/config BangBangCommandandResponse
{ "upper_threshold": 50.0, "lower_threshold": 40.0, "update_frequency": 1000, "pause_output": false, "pause_target_input": false }
/response BangBangCommandandResponse
{ "upper_threshold": 50.0, "lower_threshold": 40.0, "update_frequency": 1000, "pause_output": false, "pause_target_input": false }
/output BangBangData
{ "output": true, "input": 41.2 }
bme280
BME280 environmental sensor (temperature, pressure, humidity, dewpoint)
| Topic Suffix | Dir | Kind | Example JSON |
|---|---|---|---|
/config | in | cmd | { "standby":"62ms", "mode":"Weather", "offset":0.0 } |
/data | out | telemetry | { "temperature": { "value":23.5, "unit":"C" }, "pressure": { "value":101325, "unit":"Pa" }, "humidity": { "value":45.… |
/response | out | telemetry | { "temperature": { "value":23.5, "unit":"C" }, "pressure": { "value":101325, "unit":"Pa" }, "humidity": { "value":45.… |
Payload Schemas
/config Bme280Command
{ "standby":"62ms", "mode":"Weather", "offset":0.0 }
/data Bme280Data
{ "temperature": { "value":23.5, "unit":"C" }, "pressure": { "value":101325, "unit":"Pa" }, "humidity": { "value":45.2, "unit":"%RH" }, "dewpoint": { "value":11.2, "unit":"C" } }
/response Bme280Data
{ "temperature": { "value":23.5, "unit":"C" }, "pressure": { "value":101325, "unit":"Pa" }, "humidity": { "value":45.2, "unit":"%RH" }, "dewpoint": { "value":11.2, "unit":"C" } }
command
Send an arbitrary command to another service in-firmware
| Topic Suffix | Dir | Kind | Example JSON |
|---|---|---|---|
| `` | in | cmd | { "data":true } |
complementary_pwm
Complementary PWM output pair with deadtime
| Topic Suffix | Dir | Kind | Example JSON |
|---|---|---|---|
/config | in | cmd | { "enable":true, "duty":0.4, "frequency":20000, "deadtime":0.02 } |
/response | out | telemetry | { "enable":true, "duty":0.4, "frequency":20000, "deadtime":0.02, "error":null } |
Payload Schemas
/config ComplementaryPwmCommand
{ "enable":true, "duty":0.4, "frequency":20000, "deadtime":0.02 }
/response ComplementaryPwmCommandResponse
{ "enable":true, "duty":0.4, "frequency":20000, "deadtime":0.02, "error":null }
digital_in
Digital input state reporting
| Topic Suffix | Dir | Kind | Example JSON |
|---|---|---|---|
/out | out | telemetry | { "data": true } |
digital_out
Digital output control and feedback
| Topic Suffix | Dir | Kind | Example JSON |
|---|---|---|---|
/config | in | cmd | { "command": true } |
/response | out | telemetry | { "data": true } |
Payload Schemas
/config DigitalOutCommand
{ "command": true }
/response DigitalOutData
{ "data": true }
flowmeter
Flow meter pulse counting and rate reporting
| Topic Suffix | Dir | Kind | Example JSON |
|---|---|---|---|
/config | in | cmd | { "slope":1.0, "offset":0.0, "measurement_interval":1000 } |
/response | out | telemetry | { "slope":1.0, "offset":0.0, "measurement_interval":1000 } |
/data | out | telemetry | { "value": 3.21, "units": "L/min" } |
Payload Schemas
/config FlowMeterConfig
{ "slope":1.0, "offset":0.0, "measurement_interval":1000 }
/response FlowMeterConfig
{ "slope":1.0, "offset":0.0, "measurement_interval":1000 }
/data FlowMeterData
{ "value": 3.21, "units": "L/min" }
ir_cam
IR camera max pixel and frame row data. One frame consists of 36 rows of 24 pixels.
| Topic Suffix | Dir | Kind | Example JSON |
|---|---|---|---|
/max | out | telemetry | { "data": 41.7 } |
/{row} | out | telemetry | [23.1, 23.5, 23.6, ... 24 vals] |
Payload Schemas
/max IrCamMaxData
{ "data": 41.7 }
/{row} IrCamFrameRow
[23.1, 23.5, 23.6, ... 24 vals]
loadcell
Load cell data (publishes raw/converted weight) and tare command
| Topic Suffix | Dir | Kind | Example JSON |
|---|---|---|---|
| `` | out | telemetry | { "value": 12.34, "unit": "g" } |
/tare | in | cmd | true |
math
Arbitrary math expression using other services in a firmware. Result will either be f32 or bool depending on the configured output type of the channel.
| Topic Suffix | Dir | Kind | Example JSON |
|---|---|---|---|
/pause | in | cmd | true |
/ch{0..num_channels} | in | telemetry | {"data": 1.0 } or {"data": true } |
/response | out | telemetry | { "data":true } |
Payload Schemas
/pause MathPauseCommand
true
/ch{0..num_channels} MathResult
{"data": 1.0 } or {"data": true }
/response MathPauseResponse
{ "data":true }
mpu6050
MPU6050 IMU configuration and accel/gyro telemetry
| Topic Suffix | Dir | Kind | Example JSON |
|---|---|---|---|
/config | in | cmd | { "accel": 2, "gyro": 1 } |
/accel | out | telemetry | { "x":0.01, "y":-0.02, "z":0.98, "temp":36.5, "roll":1.2, "pitch":-0.7 } |
/gyro | out | telemetry | { "x":0.1, "y":-0.1, "z":0.05, "temp":36.5 } |
/response | out | telemetry | { "accel": "2g", "gyro": "250dps" } |
Payload Schemas
/config MpuConfig
{ "accel": 2, "gyro": 1 }
/accel MpuAccelData
{ "x":0.01, "y":-0.02, "z":0.98, "temp":36.5, "roll":1.2, "pitch":-0.7 }
/gyro MpuGyroData
{ "x":0.1, "y":-0.1, "z":0.05, "temp":36.5 }
/response MpuConfigResponse
{ "accel": "2g", "gyro": "250dps" }
pds
Power distribution system channel & rail configuration and telemetry
| Topic Suffix | Dir | Kind | Example JSON |
|---|---|---|---|
/config | in | cmd | { "rail":"Vcc2I", "over_current_limit":10, "over_voltage_limit":26, "enable":true } |
/ch0 | out | telemetry | { "state":"Running", "current":0.12, "enabled":true, "power_good":true } |
/ch1 | out | telemetry | { "state":"Running", "current":0.5, "enabled":true, "power_good":true } |
/ch2 | out | telemetry | { "state":"Disabled { rt: None }", "current":0, "enabled":false, "power_good":false } |
/ch3 | out | telemetry | { "state":"Disabled { rt: None }", "current":0, "enabled":false, "power_good":false } |
/ch4 | out | telemetry | { "state":"Disabled { rt: None }", "current":0, "enabled":false, "power_good":false } |
/ch5 | out | telemetry | { "state":"Disabled { rt: None }", "current":0, "enabled":false, "power_good":false } |
/ch6 | out | telemetry | { "state":"Disabled { rt: None }", "current":0, "enabled":false, "power_good":false } |
/ch7 | out | telemetry | { "state":"Disabled { rt: None }", "current":0, "enabled":false, "power_good":false } |
/vcc1i | out | telemetry | { "state":"Running", "current":0.50, "voltage":5.05, "enabled":true } |
/vcc2i | out | telemetry | { "state":"Running", "current":0.40, "voltage":12.08, "enabled":true } |
Payload Schemas
/config PowerRailConfig
{ "rail":"Vcc2I", "over_current_limit":10, "over_voltage_limit":26, "enable":true }
/ch0 PowerChannelResponse
{ "state":"Running", "current":0.12, "enabled":true, "power_good":true }
/ch1 PowerChannelResponse
{ "state":"Running", "current":0.5, "enabled":true, "power_good":true }
/ch2 PowerChannelResponse
{ "state":"Disabled { rt: None }", "current":0, "enabled":false, "power_good":false }
/ch3 PowerChannelResponse
{ "state":"Disabled { rt: None }", "current":0, "enabled":false, "power_good":false }
/ch4 PowerChannelResponse
{ "state":"Disabled { rt: None }", "current":0, "enabled":false, "power_good":false }
/ch5 PowerChannelResponse
{ "state":"Disabled { rt: None }", "current":0, "enabled":false, "power_good":false }
/ch6 PowerChannelResponse
{ "state":"Disabled { rt: None }", "current":0, "enabled":false, "power_good":false }
/ch7 PowerChannelResponse
{ "state":"Disabled { rt: None }", "current":0, "enabled":false, "power_good":false }
/vcc1i PowerRailResponse
{ "state":"Running", "current":0.50, "voltage":5.05, "enabled":true }
/vcc2i PowerRailResponse
{ "state":"Running", "current":0.40, "voltage":12.08, "enabled":true }
pid
PID controller command, response, and output topics
| Topic Suffix | Dir | Kind | Example JSON |
|---|---|---|---|
/config | in | cmd | { "kp":0.2, "ki":0.02, "kd":0.4, "setpoint":1.0, "pause_output":false, "pause_target_input":false } |
/response | out | telemetry | { "kp":0.2, "ki":0.02, "kd":0.4, "setpoint":1.0, "pause_output":false, "pause_target_input":false } |
/output | out | telemetry | { "output":0.15, "last_output":0.14, "setpoint":1.0, "input":0.92 } |
Payload Schemas
/config PidCommandAndResponse
{ "kp":0.2, "ki":0.02, "kd":0.4, "setpoint":1.0, "pause_output":false, "pause_target_input":false }
/response PidCommandAndResponse
{ "kp":0.2, "ki":0.02, "kd":0.4, "setpoint":1.0, "pause_output":false, "pause_target_input":false }
/output PidData
{ "output":0.15, "last_output":0.14, "setpoint":1.0, "input":0.92 }
pwm
Standard PWM output control and response
| Topic Suffix | Dir | Kind | Example JSON |
|---|---|---|---|
/config | in | cmd | { "enable":true, "duty":0.5, "frequency":1000 } |
/response | out | telemetry | { "enable":true, "duty":0.5, "frequency":1000, "error":null } |
Payload Schemas
/config PWMCommand
{ "enable":true, "duty":0.5, "frequency":1000 }
/response PWMCommandResponse
{ "enable":true, "duty":0.5, "frequency":1000, "error":null }
qmc5883l
QMC5883L magnetometer heading / vector data and configuration
| Topic Suffix | Dir | Kind | Example JSON |
|---|---|---|---|
/config | in | cmd | { "field_range":2, "data_rate":50, "oversample":512, "declination": -13.2 } |
| `` | out | telemetry | { "x": 120.0, "y": -30.5, "z": 5.2, "heading": 182.4 } |
/response | out | telemetry | { "success": { "field_range":2, "data_rate":50, "oversample":512, "declination": -13.2 }, "error": null } |
Payload Schemas
/config Qmc5883lConfig
{ "field_range":2, "data_rate":50, "oversample":512, "declination": -13.2 }
`` Qmc5883lData
{ "x": 120.0, "y": -30.5, "z": 5.2, "heading": 182.4 }
/response Qmc5883lConfigResponse
{ "success": { "field_range":2, "data_rate":50, "oversample":512, "declination": -13.2 }, "error": null }
stateful_actuator
Stateful actuator sequences, moves and status topics (schema-defined config)
| Topic Suffix | Dir | Kind | Example JSON |
|---|---|---|---|
/command | in | cmd | { "command": "TRANSITION"} |
/fault | in | cmd | { "error": "Invalid State", "inputs": [true,false], "outputs": [true,false], "current_state": "IDLE" } |
/sequence | out | telemetry | { "name": "seq1", "success": true } |
/state | out | telemetry | { "success": true, "inputs": [true,false], "outputs": [true,false], "current_state": "IDLE" } |
Payload Schemas
/command StatefulActuatorCommand
{ "command": "TRANSITION"}
/fault StatefulActuatorFault
{ "error": "Invalid State", "inputs": [true,false], "outputs": [true,false], "current_state": "IDLE" }
/sequence StatefulActuatorSequenceStatus
{ "name": "seq1", "success": true }
/state StatefulActuatorState
{ "success": true, "inputs": [true,false], "outputs": [true,false], "current_state": "IDLE" }
stepper
Stepper driver motion command, response and status progress
| Topic Suffix | Dir | Kind | Example JSON |
|---|---|---|---|
/config | in | cmd | { "target_accel":0.1, "max_velocity":0.5, "num_steps":2000, "direction":true, "enable":true } |
/response | out | telemetry | { "target_accel":0.1, "max_velocity":0.5, "num_steps":2000, "direction":true, "enable":true } |
/status | out | telemetry | { "percent": 42, "steps": 840, "position": 1234 } |
Payload Schemas
/config StepperConfig
{ "target_accel":0.1, "max_velocity":0.5, "num_steps":2000, "direction":true, "enable":true }
/response StepperConfig
{ "target_accel":0.1, "max_velocity":0.5, "num_steps":2000, "direction":true, "enable":true }
/status StepperStatus
{ "percent": 42, "steps": 840, "position": 1234 }
thermocouple
Thermocouple temperature readings
| Topic Suffix | Dir | Kind | Example JSON |
|---|---|---|---|
/temperature | out | telemetry | { "temperature": 23.5, "ambient": 22.1, "unit": "C", "error": null } |
Payload Schemas
/temperature ThermocoupleData
{ "temperature": 23.5, "ambient": 22.1, "unit": "C", "error": null }